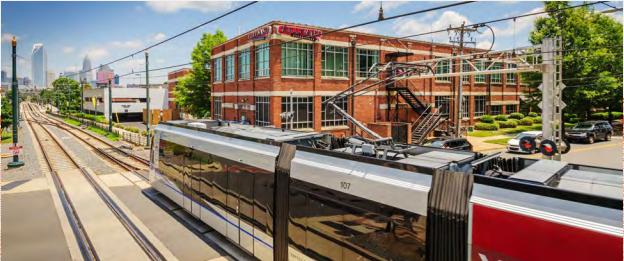
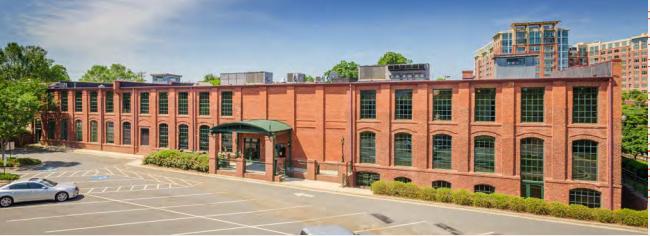
Truly a Charlotte native, these three beautifully-renovated historic buildings date back to the early 1900s and once housed one of the first factories in the Dilworth industrial district. Today, Steel Yard is a neighborhood icon. The center of it all. Just steps away from multifamily living, retail, the light rail system, and some of the city’s best restaurants, Steel Yard is the perfect place to grow your business and your brand in the heart of Charlotte’s thriving South End.
Three renovated historic buildings with flexible space that can accommodate growth
Booming office location with a mix of a casual and professional work environment
Easy accessibility to downtown Charlotte with excellent visibility and client access
Plenty of parking available with both surface and deck options
Local, responsive management and landlord
Two on-site restaurants: Sullivan’s Steakhouse and Luciano’s Ristorante Italiano
Within walking distance to LYNX stations and some of Charlotte’s most popular restaurants and shopping
AVAILABILITIES
1900 South Boulevard
Suite 101: 1,250 RSF - Click here to view the virtual tour
Suite 200: 8,289 RSF - Click here to view the virtual tour
Suite 306: 2,197 RSF - Click here to view the virtual tour
Suite 308: 4,945 RSF - Click here to view the virtual tour
1910 South Boulevard
No availabilities
1928 South Boulevard
No availabilities
Details
Size
78,539 sq ft
Year Built
1930s
Total Available
15,215 sq ft
Min Available
1,250 sq ft
Max Contiguous
8,829 sq ft
Lease Rate
$35.50
No part of this information may be copied, reproduced, repurposed, or screen-captured for any commercial purpose without prior written authorization from MyEListing.
While we strive to provide the most accurate information, all listing information, and demographic data, is provided by third-parties. As such, MyEListing will not be responsible for the accuracy of the information. It is strongly recommended that you verify all information with the listing agent, and any relevant agencies, prior to making any decisions.
What is the asking price for 1900 South Boulevard in Charlotte?
The asking price for 1900 South Boulevard is $35.50 a SF per Year
What is the building size of this commercial Retail property?
The size of this multi-unit property varies between 1250 - 78539 square feet
What kind of Retail is the propery at 1900 South Boulevard?
The property at 1900 South Boulevard Charlotte, NC 28203 is listed as a Free Standing Building Retail property
What is the population within 1 mile of 1900 South Boulevard in Charlotte?
The population within 1 mile of 1900 South Boulevard Charlotte, NC 28203 is 15,279 people.
Who do I contact for questions about 1900 South Boulevard?
You should contact the listing agent,
Maddy Howey, for any details regarding this commercial listing.