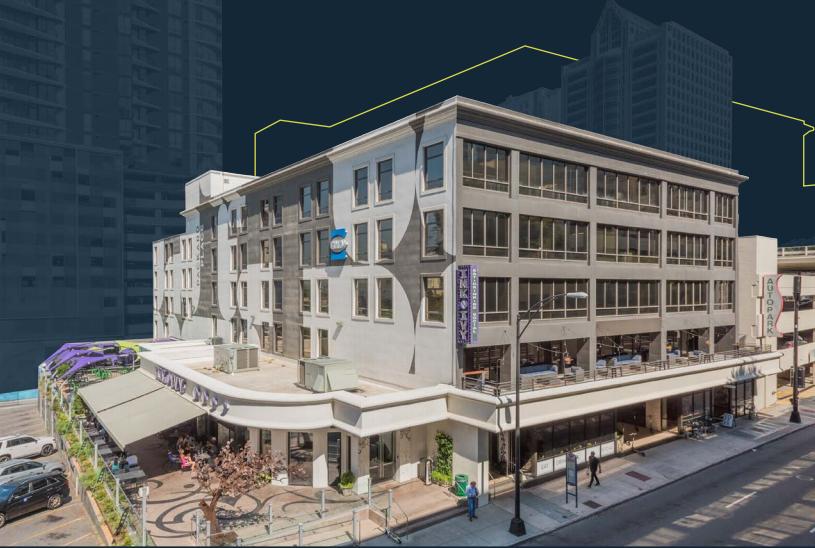
With a focus on community and creative thinking, Packard Place offers tenants the perfect mix of business and pleasure.
Convenient access to Not Just Coffee & Ink N Ivy
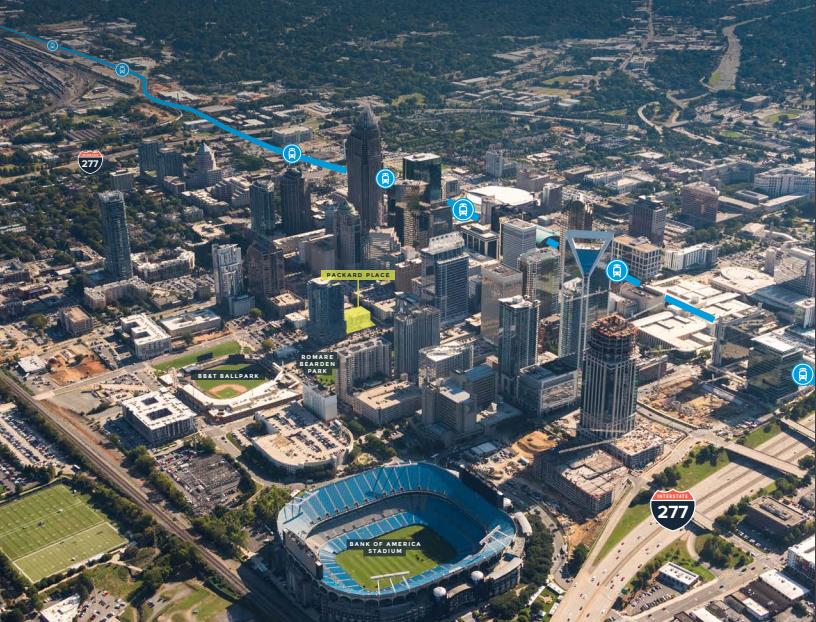
Onsite parking and ample surface parking lots in close vicinity
Walkable to downtown’s most popular restaurants and sporting venues
Building Wi-Fi extends to Romare Bearden Park
Exterior signage opportunity
24/7 tenant key card access
Open-air staircases to allow for safe social distancing
Fitness center with locker room & showers
125-person event space and conference rooms / kitchen
Details
Size
95,128 sq ft
Total Available
83,593 sq ft
Lease Rate
$28.00
No part of this information may be copied, reproduced, repurposed, or screen-captured for any commercial purpose without prior written authorization from MyEListing.
While we strive to provide the most accurate information, all listing information, and demographic data, is provided by third-parties. As such, MyEListing will not be responsible for the accuracy of the information. It is strongly recommended that you verify all information with the listing agent, and any relevant agencies, prior to making any decisions.
What is the asking price for 222 South Church Street in Charlotte?
The asking price for 222 South Church Street is $28.00 a SF per Year
What is the building size of this commercial Office property?
The size of this lease property at '.222 South Church Street.' is 95128 square feet
What kind of Office is the propery at 222 South Church Street?
The property at 222 South Church Street Charlotte, NC 28202 is listed as a Professional Office property
What is the population within 1 mile of 222 South Church Street in Charlotte?
The population within 1 mile of 222 South Church Street Charlotte, NC 28202 is 18,764 people.
Who do I contact for questions about 222 South Church Street?
You should contact the listing agent,
Maddy Howey, for any details regarding this commercial listing.