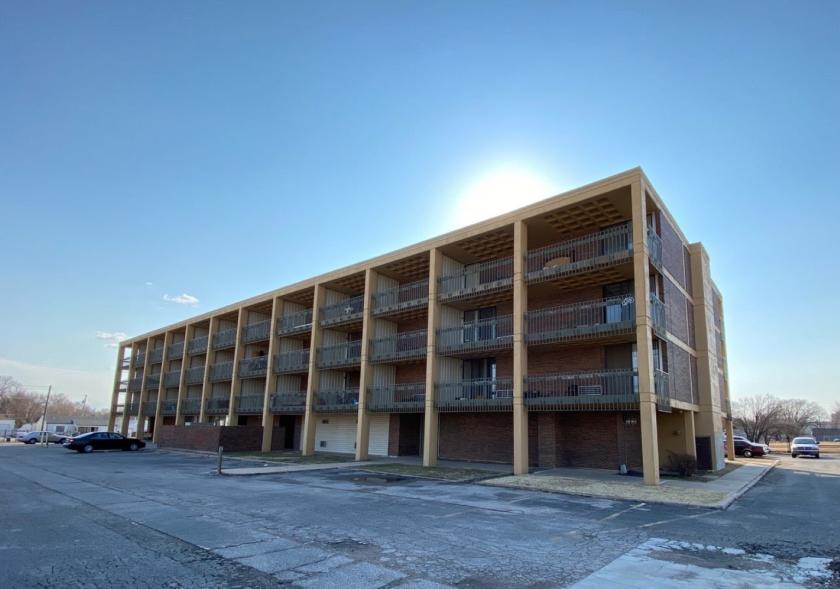
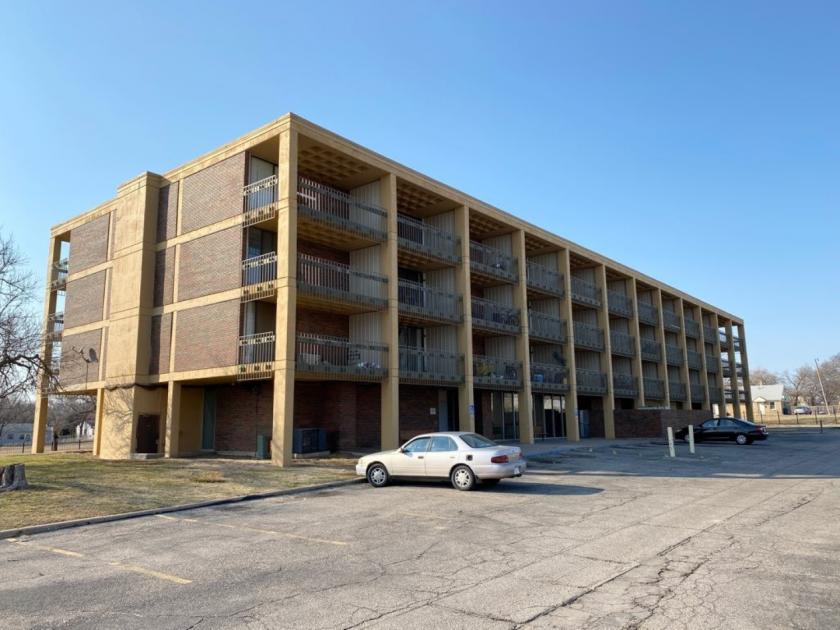
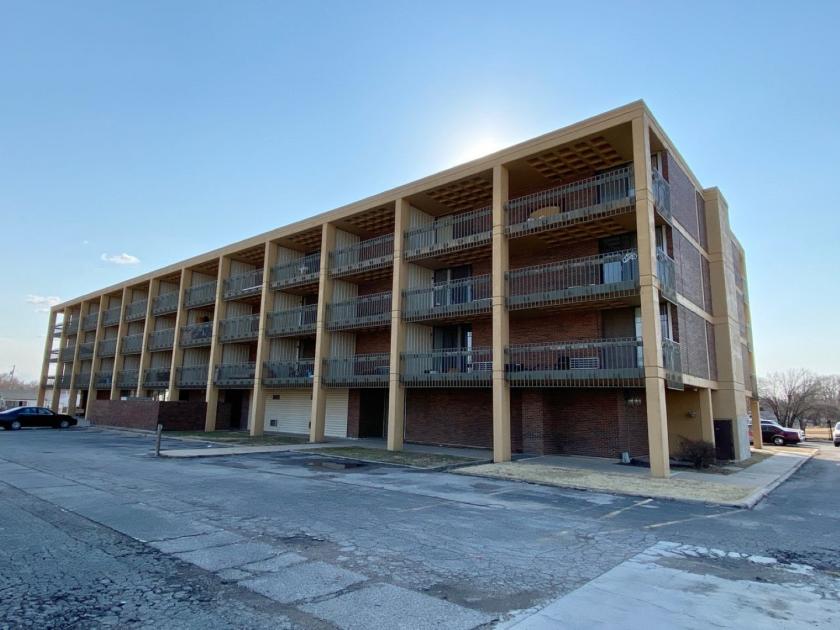
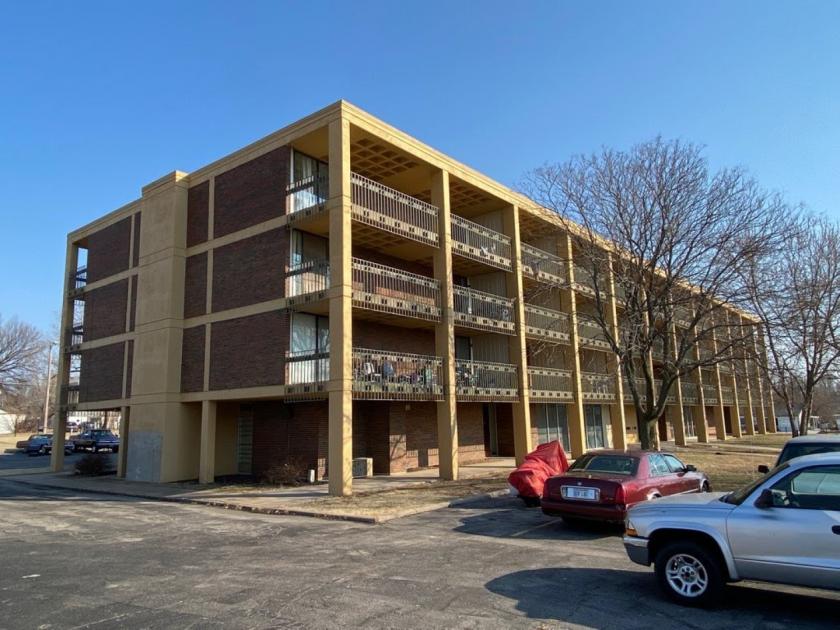
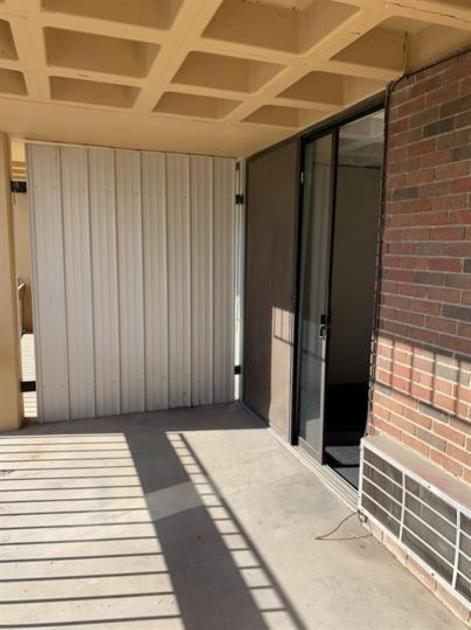
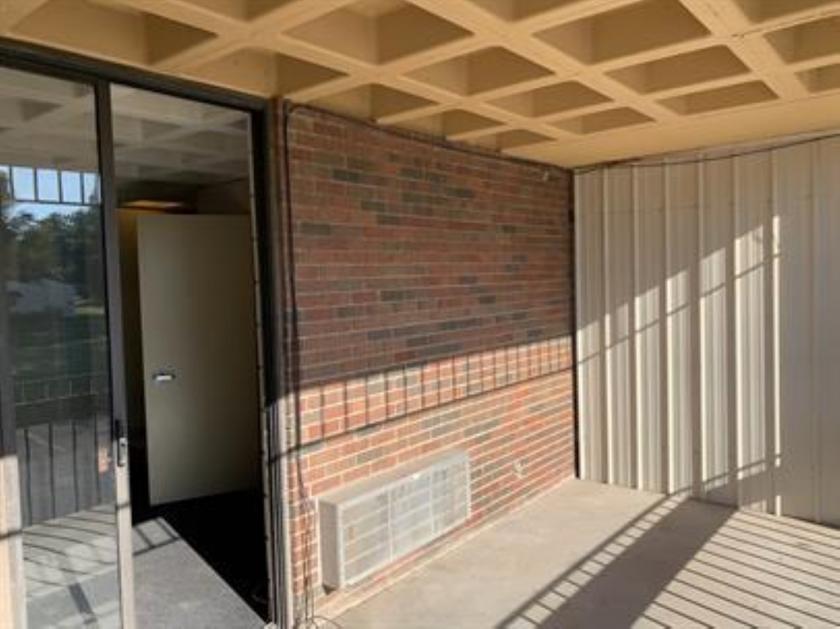
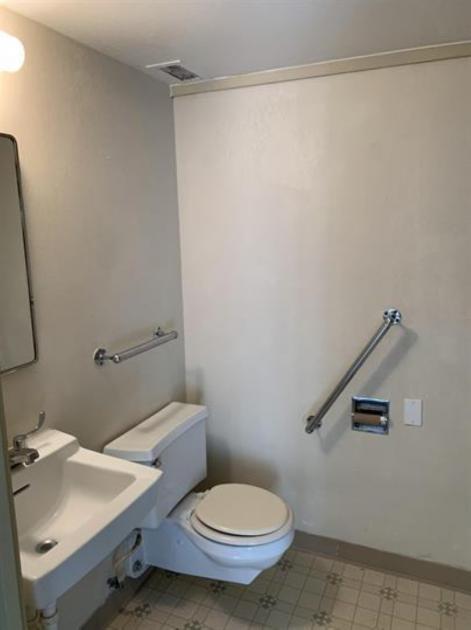
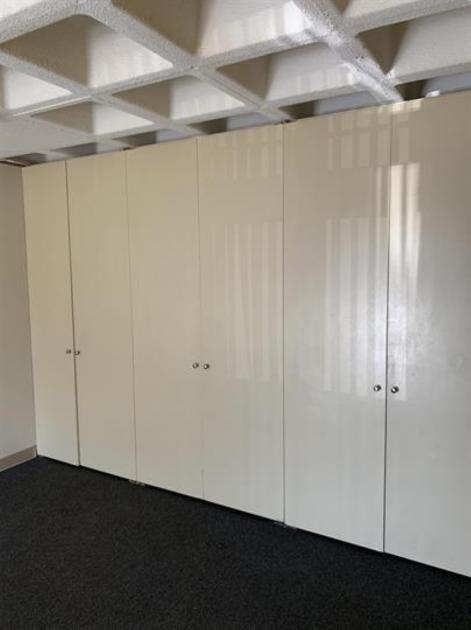
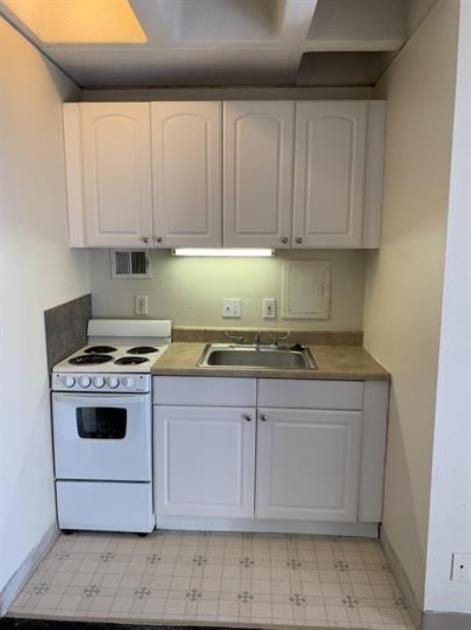
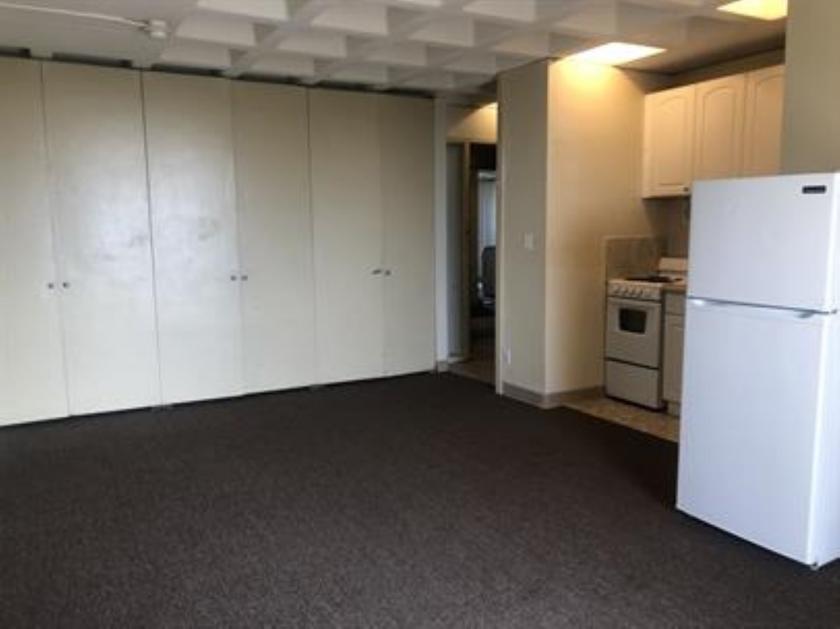
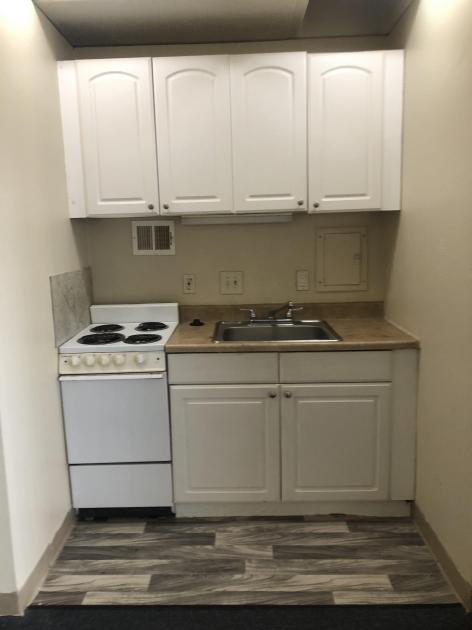
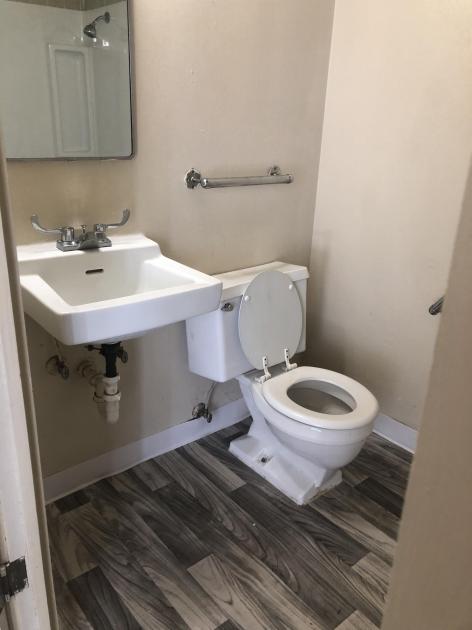
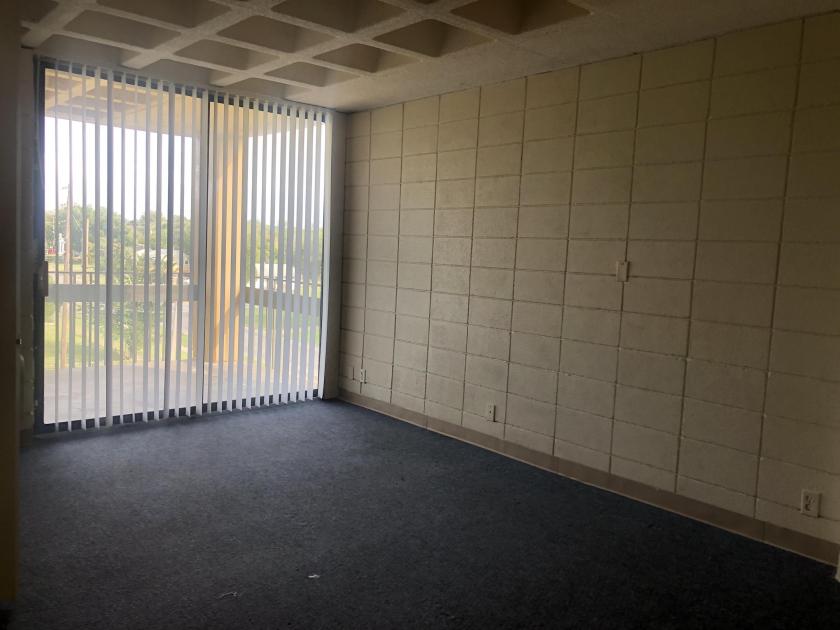
MAJOR potential with a lot of hard work already put in! Seller has spent a lot of time turning this complex around from repairs to the good tenants now in place. This complex features 54 studios and 6 one bedroom units and has the potential of adding another 2-6 units on the ground floor. Each floor has a communal laundry room. Over 39K worth of repairs done since August and over half of the units have had repairs made varying new PTAC units, appliances, flooring, and more. Monthly pest control has been put in place since initial treatment started in August. Elevator repairs have been made to ensure the unit is up to code as well as all fire inspection repairs to bring everything up to code. Main sewer line and SW sewer line to the main both have been cleared and several water lines fully replaced.These apartments currently have a 58% vacancy rate and current gross income of $151,740 with a potential of $367,200! With freshly updated apartments and Wichita State nearby, the potential is definitely there. Are you up for the challenge?Preapproval/POF required for showings, common and vacant units shown only. Title company to be Kansas Secured Title. Owner paid utilities also includes Cox. All units have individual PTAC units for heating and cooling which are all electric. Owner owns all appliances.Selling agent responsible for personally verifying schools, measurements, and tax information. Please submit all offers toHollyHaws@kw.com. Escrow Instructions: Buyer and Seller understand Earnest Money will be held by Buyer Representative until offer acceptance by all parties. Within 5 business days of Effective date, Buyers Representative will deliver earnest money to Escrow Agent.