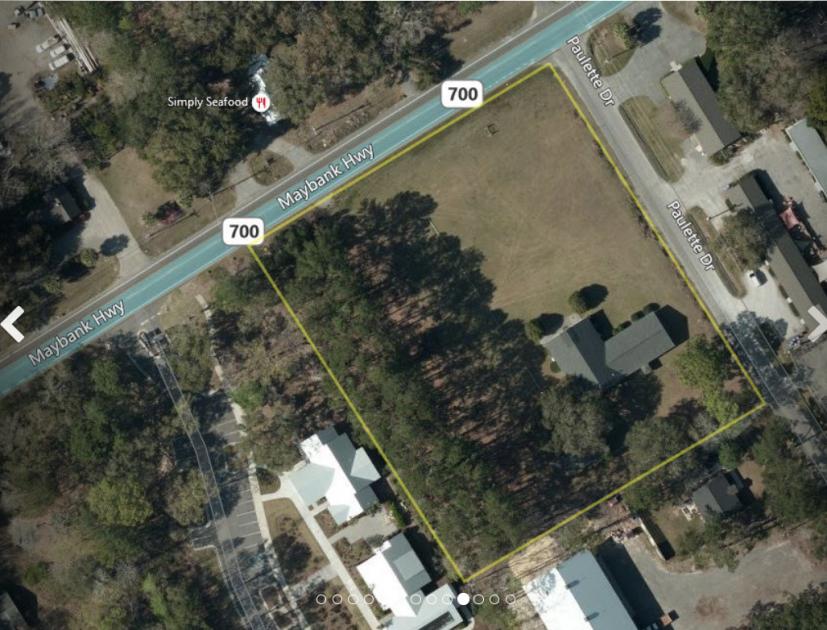
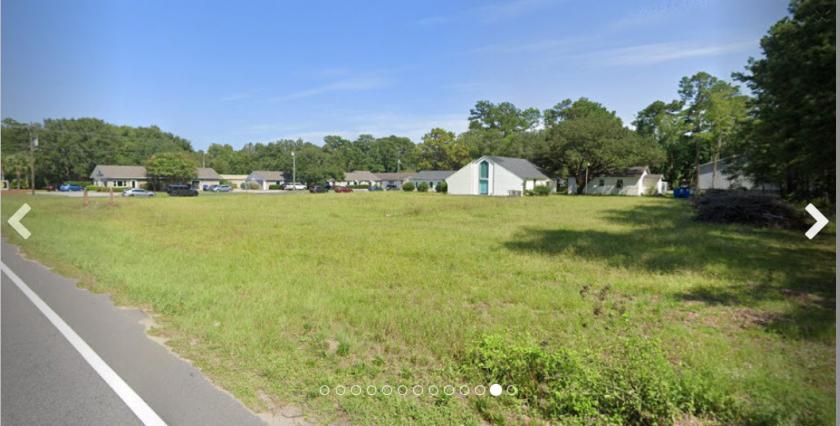
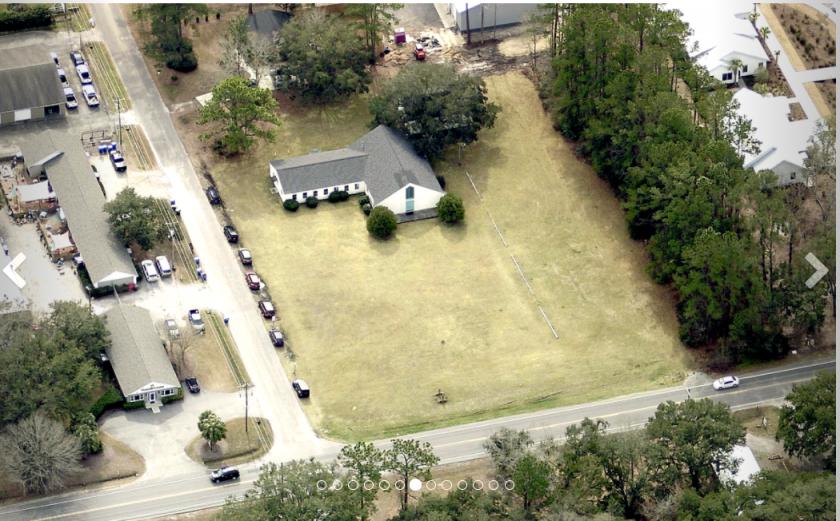
1-Mile | 3-Miles | 5-Miles | ||
---|---|---|---|---|
Total Population | 2,099 | 10,878 | 32,504 | |
Population Median Age | 41 | 41 | 41 | |
Population by Age | 0-9 Yrs | 264 (12%) | 1256 (11%) | 3365 (10%) |
10-19 Yrs | 78 (3%) | 527 (4%) | 2274 (6%) | |
20-29 Yrs | 333 (15%) | 1561 (14%) | 4161 (12%) | |
30-39 Yrs | 390 (18%) | 1998 (18%) | 6661 (20%) | |
40-49 Yrs | 263 (12%) | 1388 (12%) | 3648 (11%) | |
50-59 Yrs | 292 (13%) | 1644 (15%) | 4809 (14%) | |
60-69 Yrs | 269 (12%) | 1399 (12%) | 4210 (12%) | |
70+ Yrs | 210 (10%) | 1106 (10%) | 3376 (10%) | |
Median HH Income | $76,445 | $75,393 | $76,031 | |
Total Household Income | < 24K | 114 (13%) | 585 (13%) | 1827 (13%) |
25-49K | 150 (17%) | 742 (16%) | 2320 (17%) | |
50-74K | 167 (19%) | 871 (19%) | 2447 (18%) | |
75-99K | 116 (13%) | 584 (13%) | 2056 (15%) | |
100-199K | 292 (33%) | 1401 (31%) | 3686 (27%) | |
200K+ | 37 (4%) | 231 (5%) | 1021 (7%) | |
Highest Education Level | No Diploma | 63 | 390 | 1245 |
Diploma or GED | 446 | 2260 | 6048 | |
Some College | 236 | 1492 | 4301 | |
Assoc. Degree | 175 | 869 | 2453 | |
Bachelors Degree | 497 | 2406 | 7526 | |
Higher Degree | 268 | 1306 | 3999 | |
Total Housing Units | 957 | 4,951 | 14,996 | |
--Owner-Occupied | 643 | 3,317 | 9,604 | |
--Renter-Occupied | 233 | 1,097 | 3,754 | |
Owner-Occupied Values | < 100K | 45 | 287 | 850 |
100-199K | 108 | 596 | 1761 | |
200-299K | 202 | 900 | 2568 | |
300-399K | 166 | 777 | 2019 | |
400-499K | 61 | 293 | 915 | |
500K+ | 59 | 465 | 1490 | |
Total Working Age Population | 1,770 | 9,225 | 27,570 | |
In Work Force | 1,232 | 6,482 | 19,826 | |
Not In Work Force | 539 | 2,743 | 7,745 | |
Workforce Employed | 1,164 | 6,205 | 19,137 | |
Workforce Unemployed | 58 | 244 | 583 | |
Civlian Workforce | 1,222 | 6,449 | 19,720 | |
Military Workforce | 9 | 32 | 106 | |
Total Households | 876 | 4,414 | 13,358 | |
Family Households | 550 | 2,894 | 8,350 | |
Non-Family Households | 326 | 1,520 | 5,008 | |
Married Couple | 441 | 2,296 | 6,683 | |
Other Family | 109 | 598 | 1,666 | |
Married w/Child | 123 | 670 | 2,103 | |
Single Male w/Child | 4 | 17 | 100 | |
Single Female w/Child | 34 | 162 | 416 |
Population Change Last Two Decades - Plus Projection
2000 | % | 2010 | % | 2020 | % | 2030 | |
---|---|---|---|---|---|---|---|
South Carolina | 4,012,012 | +15 | 4,625,364 | +9 | 5,020,400 | +9 | 5,488,460 |
Charleston County | 309,969 | +13 | 350,209 | +5 | 366,380 | +6 | 386,660 |
Total Working Age Population:
Total Households:
Total Working Age Population:
Total Households:
Total Working Age Population:
Total Households: