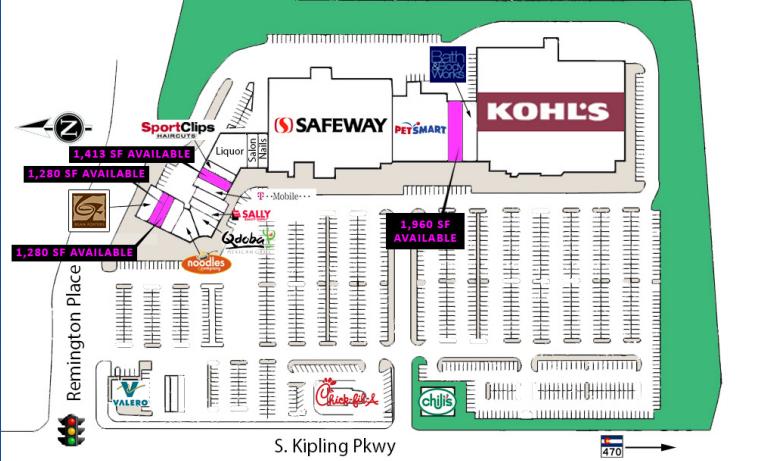
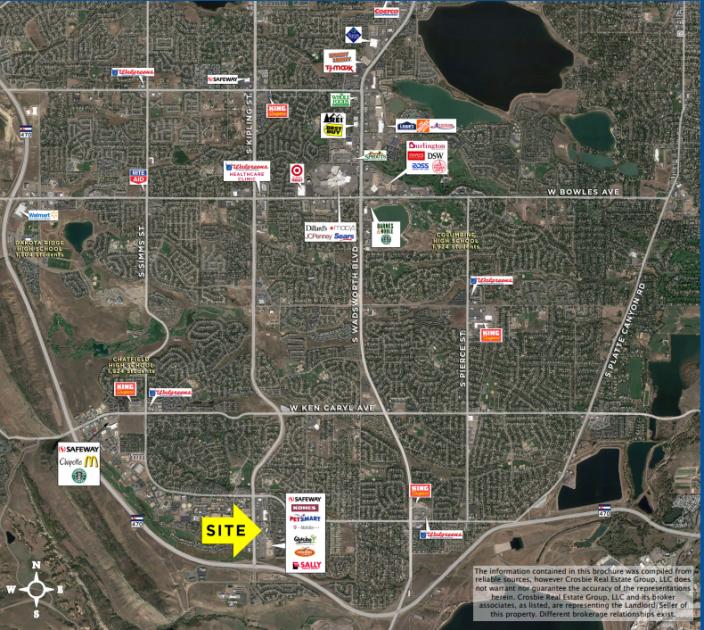
1-Mile | 3-Miles | 5-Miles | ||
---|---|---|---|---|
Total Population | 9,289 | 56,965 | 132,410 | |
Population Median Age | 39 | 40 | 41 | |
Population by Age | 0-9 Yrs | 906 (9%) | 7234 (12%) | 15115 (11%) |
10-19 Yrs | 1277 (13%) | 7207 (12%) | 16184 (12%) | |
20-29 Yrs | 1046 (11%) | 5529 (9%) | 13211 (9%) | |
30-39 Yrs | 1289 (13%) | 7575 (13%) | 16813 (12%) | |
40-49 Yrs | 1449 (15%) | 7941 (13%) | 18536 (13%) | |
50-59 Yrs | 1374 (14%) | 8672 (15%) | 20657 (15%) | |
60-69 Yrs | 1309 (14%) | 8093 (14%) | 18230 (13%) | |
70+ Yrs | 640 (6%) | 4714 (8%) | 13663 (10%) | |
Median HH Income | $85,380 | $98,880 | $99,268 | |
Total Household Income | < 24K | 434 (10%) | 1728 (7%) | 4034 (7%) |
25-49K | 533 (13%) | 2891 (13%) | 6787 (12%) | |
50-74K | 726 (18%) | 3103 (14%) | 7624 (14%) | |
75-99K | 754 (18%) | 3389 (15%) | 8030 (15%) | |
100-199K | 1235 (30%) | 8366 (38%) | 18802 (35%) | |
200K+ | 330 (8%) | 2441 (11%) | 7205 (13%) | |
Highest Education Level | No Diploma | 112 | 862 | 2463 |
Diploma or GED | 1036 | 6671 | 14718 | |
Some College | 1745 | 9490 | 20732 | |
Assoc. Degree | 563 | 3691 | 7926 | |
Bachelors Degree | 2118 | 13225 | 32492 | |
Higher Degree | 992 | 6205 | 17078 | |
Total Housing Units | 4,096 | 22,485 | 53,678 | |
--Owner-Occupied | 3,339 | 18,483 | 42,356 | |
--Renter-Occupied | 673 | 3,435 | 10,126 | |
Owner-Occupied Values | < 100K | 71 | 198 | 718 |
100-199K | 287 | 1115 | 1813 | |
200-299K | 959 | 3387 | 6539 | |
300-399K | 927 | 4965 | 11068 | |
400-499K | 557 | 4730 | 10539 | |
500K+ | 538 | 4089 | 11678 | |
Total Working Age Population | 7,591 | 45,184 | 107,081 | |
In Work Force | 5,489 | 32,421 | 75,147 | |
Not In Work Force | 2,102 | 12,763 | 31,934 | |
Workforce Employed | 5,304 | 31,345 | 72,559 | |
Workforce Unemployed | 185 | 1,064 | 2,515 | |
Civlian Workforce | 5,489 | 32,410 | 75,073 | |
Military Workforce | 0 | 12 | 74 | |
Total Households | 4,012 | 21,918 | 52,482 | |
Family Households | 2,432 | 16,294 | 37,456 | |
Non-Family Households | 1,580 | 5,623 | 15,027 | |
Married Couple | 1,798 | 13,232 | 31,067 | |
Other Family | 634 | 3,062 | 6,388 | |
Married w/Child | 729 | 5,238 | 11,787 | |
Single Male w/Child | 109 | 547 | 1,266 | |
Single Female w/Child | 193 | 1,095 | 2,116 |
Population Change Last Two Decades - Plus Projection
2000 | % | 2010 | % | 2020 | % | 2030 | |
---|---|---|---|---|---|---|---|
Colorado | 4,301,261 | +17 | 5,029,196 | +16 | 5,838,181 | +15 | 6,733,658 |
Arapahoe County | 487,967 | +17 | 572,003 | +16 | 662,304 | +13 | 750,773 |
Denver County | 554,636 | +8 | 600,158 | +23 | 738,611 | +12 | 827,681 |
Douglas County | 175,766 | +62 | 285,465 | +23 | 350,161 | +16 | 405,087 |
Jefferson County | 527,056 | +1 | 534,543 | +10 | 587,118 | +7 | 626,742 |
Total Working Age Population:
Total Households:
Total Working Age Population:
Total Households:
Total Working Age Population:
Total Households: