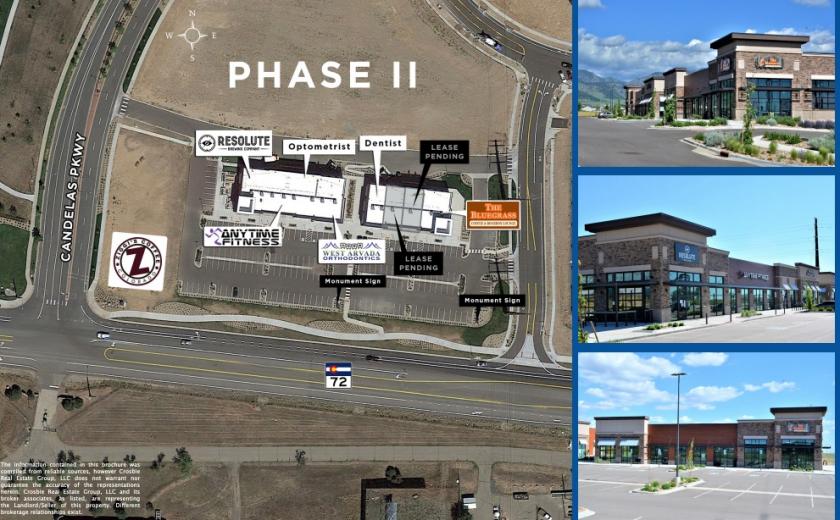
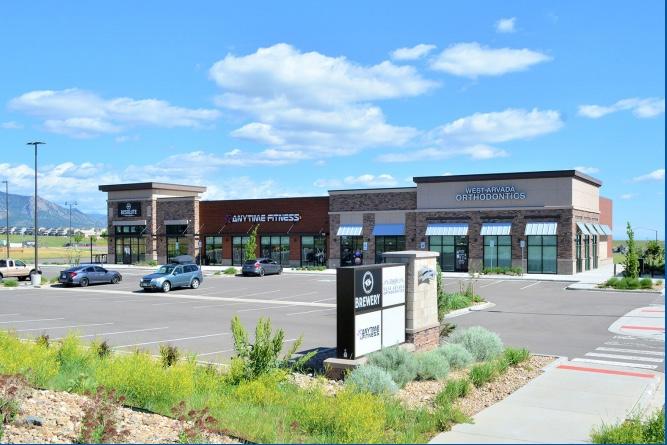
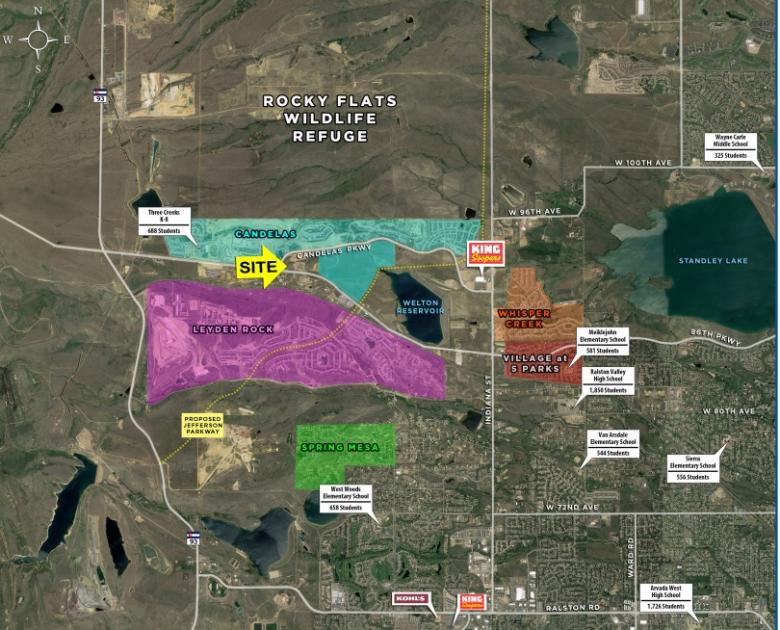
1-Mile | 3-Miles | 5-Miles | ||
---|---|---|---|---|
Total Population | 1,379 | 12,803 | 60,784 | |
Population Median Age | 35 | 37 | 40 | |
Population by Age | 0-9 Yrs | 273 (19%) | 2045 (15%) | 7523 (12%) |
10-19 Yrs | 183 (13%) | 1792 (13%) | 8172 (13%) | |
20-29 Yrs | 76 (5%) | 719 (5%) | 5149 (8%) | |
30-39 Yrs | 269 (19%) | 2081 (16%) | 8876 (14%) | |
40-49 Yrs | 199 (14%) | 2049 (16%) | 8427 (13%) | |
50-59 Yrs | 175 (12%) | 1828 (14%) | 9756 (16%) | |
60-69 Yrs | 114 (8%) | 1365 (10%) | 7207 (11%) | |
70+ Yrs | 92 (6%) | 927 (7%) | 5674 (9%) | |
Median HH Income | $156,124 | $153,664 | $120,706 | |
Total Household Income | < 24K | 15 (3%) | 122 (2%) | 1158 (5%) |
25-49K | 29 (6%) | 296 (6%) | 2285 (10%) | |
50-74K | 40 (8%) | 382 (8%) | 2866 (12%) | |
75-99K | 32 (7%) | 341 (7%) | 2584 (11%) | |
100-199K | 198 (43%) | 1961 (44%) | 9115 (40%) | |
200K+ | 138 (30%) | 1334 (30%) | 4456 (19%) | |
Highest Education Level | No Diploma | 19 | 155 | 1321 |
Diploma or GED | 95 | 1005 | 6401 | |
Some College | 186 | 1602 | 8187 | |
Assoc. Degree | 42 | 446 | 3011 | |
Bachelors Degree | 329 | 3200 | 14354 | |
Higher Degree | 229 | 2287 | 9414 | |
Total Housing Units | 470 | 4,588 | 22,983 | |
--Owner-Occupied | 427 | 4,174 | 19,556 | |
--Renter-Occupied | 24 | 261 | 2,908 | |
Owner-Occupied Values | < 100K | 0 | 15 | 219 |
100-199K | 0 | 16 | 250 | |
200-299K | 0 | 58 | 1666 | |
300-399K | 16 | 294 | 4272 | |
400-499K | 61 | 700 | 4682 | |
500K+ | 350 | 3092 | 8467 | |
Total Working Age Population | 977 | 9,571 | 48,164 | |
In Work Force | 769 | 7,291 | 34,263 | |
Not In Work Force | 208 | 2,280 | 13,901 | |
Workforce Employed | 749 | 7,127 | 33,276 | |
Workforce Unemployed | 18 | 146 | 955 | |
Civlian Workforce | 767 | 7,273 | 34,232 | |
Military Workforce | 1 | 18 | 31 | |
Total Households | 451 | 4,435 | 22,464 | |
Family Households | 389 | 3,762 | 17,317 | |
Non-Family Households | 63 | 673 | 5,146 | |
Married Couple | 368 | 3,456 | 15,248 | |
Other Family | 20 | 306 | 2,069 | |
Married w/Child | 199 | 1,632 | 6,360 | |
Single Male w/Child | 4 | 75 | 370 | |
Single Female w/Child | 10 | 146 | 756 |
Population Change Last Two Decades - Plus Projection
2000 | % | 2010 | % | 2020 | % | 2030 | |
---|---|---|---|---|---|---|---|
Colorado | 4,301,261 | +17 | 5,029,196 | +16 | 5,838,181 | +15 | 6,733,658 |
Boulder County | 291,288 | +1 | 294,567 | +13 | 332,134 | +12 | 370,618 |
Broomfield County | 0 | 55,889 | +32 | 73,822 | +28 | 94,282 | |
Jefferson County | 527,056 | +1 | 534,543 | +10 | 587,118 | +7 | 626,742 |
Total Working Age Population:
Total Households:
Total Working Age Population:
Total Households:
Total Working Age Population:
Total Households: