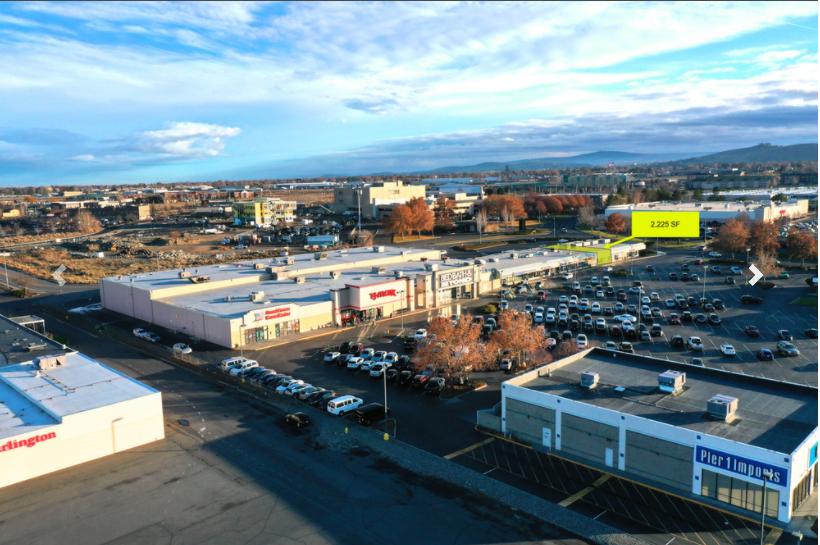
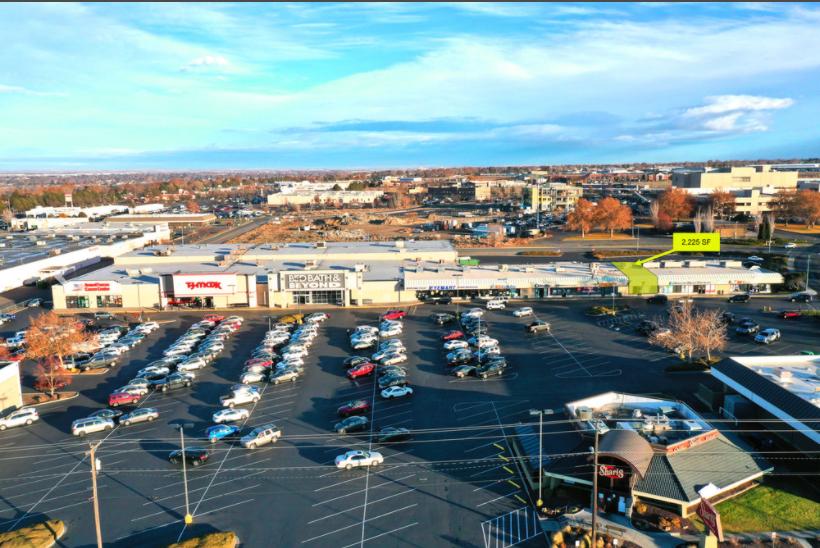
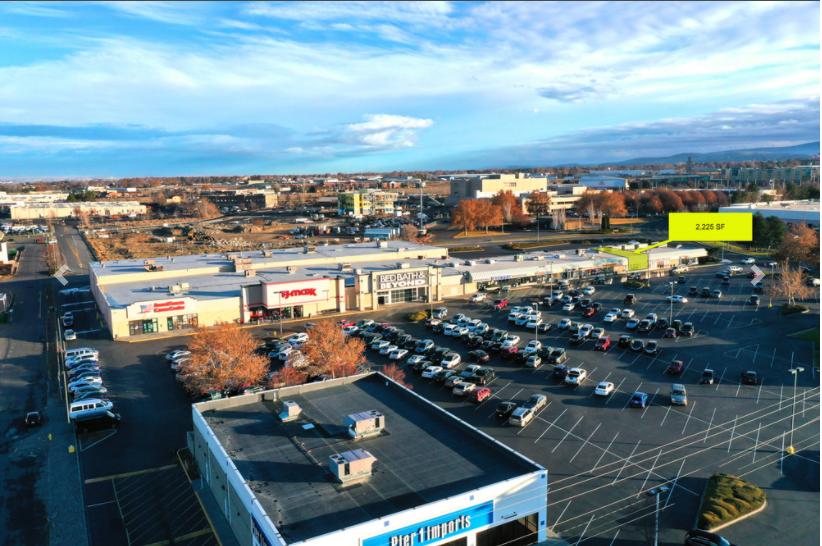
1-Mile | 3-Miles | 5-Miles | ||
---|---|---|---|---|
Total Population | 7,536 | 61,561 | 146,343 | |
Population Median Age | 37 | 38 | 36 | |
Population by Age | 0-9 Yrs | 991 (13%) | 9062 (14%) | 23586 (16%) |
10-19 Yrs | 857 (11%) | 7519 (12%) | 20498 (14%) | |
20-29 Yrs | 1418 (18%) | 9030 (14%) | 20446 (13%) | |
30-39 Yrs | 1066 (14%) | 8031 (13%) | 21006 (14%) | |
40-49 Yrs | 1019 (13%) | 6945 (11%) | 16468 (11%) | |
50-59 Yrs | 714 (9%) | 7728 (12%) | 16737 (11%) | |
60-69 Yrs | 907 (12%) | 6396 (10%) | 14301 (9%) | |
70+ Yrs | 563 (7%) | 6849 (11%) | 13301 (9%) | |
Median HH Income | $67,308 | $69,755 | $68,211 | |
Total Household Income | < 24K | 434 (16%) | 3670 (15%) | 8217 (15%) |
25-49K | 526 (19%) | 4526 (19%) | 10422 (19%) | |
50-74K | 505 (19%) | 4470 (18%) | 10599 (20%) | |
75-99K | 487 (18%) | 3406 (14%) | 7013 (13%) | |
100-199K | 597 (22%) | 5990 (25%) | 13287 (25%) | |
200K+ | 92 (3%) | 1542 (6%) | 3427 (6%) | |
Highest Education Level | No Diploma | 484 | 3064 | 9423 |
Diploma or GED | 1434 | 10063 | 22819 | |
Some College | 1311 | 10048 | 22559 | |
Assoc. Degree | 632 | 4230 | 9807 | |
Bachelors Degree | 669 | 8057 | 17324 | |
Higher Degree | 471 | 5121 | 10497 | |
Total Housing Units | 2,894 | 24,670 | 55,521 | |
--Owner-Occupied | 1,645 | 15,260 | 35,565 | |
--Renter-Occupied | 995 | 8,344 | 17,400 | |
Owner-Occupied Values | < 100K | 107 | 997 | 2660 |
100-199K | 549 | 3494 | 10146 | |
200-299K | 734 | 5395 | 11987 | |
300-399K | 195 | 3449 | 6379 | |
400-499K | 30 | 1027 | 2230 | |
500K+ | 30 | 898 | 2163 | |
Total Working Age Population | 5,984 | 47,857 | 110,177 | |
In Work Force | 3,610 | 30,255 | 71,023 | |
Not In Work Force | 2,374 | 17,601 | 39,153 | |
Workforce Employed | 3,490 | 28,510 | 67,235 | |
Workforce Unemployed | 120 | 1,708 | 3,665 | |
Civlian Workforce | 3,610 | 30,218 | 70,900 | |
Military Workforce | 0 | 37 | 124 | |
Total Households | 2,640 | 23,603 | 52,965 | |
Family Households | 1,626 | 15,214 | 35,903 | |
Non-Family Households | 1,014 | 8,390 | 17,062 | |
Married Couple | 1,348 | 11,889 | 27,314 | |
Other Family | 278 | 3,325 | 8,589 | |
Married w/Child | 526 | 4,694 | 12,214 | |
Single Male w/Child | 77 | 667 | 1,480 | |
Single Female w/Child | 114 | 1,597 | 4,017 |
Population Change Last Two Decades - Plus Projection
2000 | % | 2010 | % | 2020 | % | 2030 | |
---|---|---|---|---|---|---|---|
Washington | 5,894,121 | +14 | 6,724,540 | +14 | 7,638,415 | +11 | 8,503,178 |
Benton County | 142,475 | +23 | 175,177 | +15 | 201,563 | +13 | 228,162 |
Franklin County | 49,347 | +58 | 78,163 | +28 | 99,712 | +28 | 127,443 |
Total Working Age Population:
Total Households:
Total Working Age Population:
Total Households:
Total Working Age Population:
Total Households: