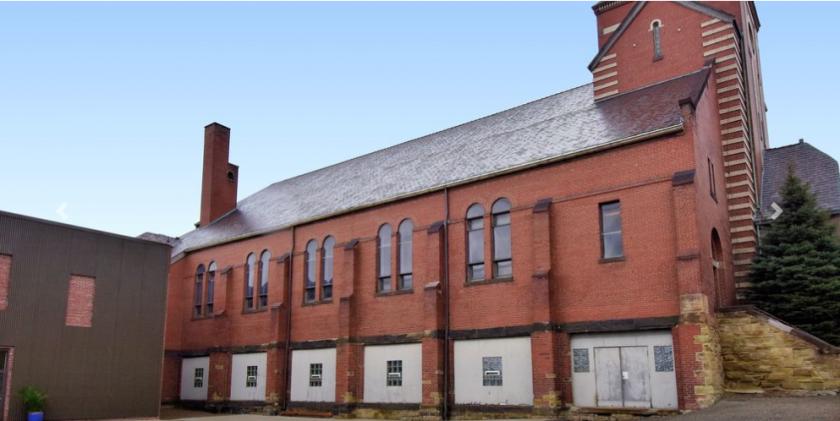
SVN | Three Rivers Commercial Advisors is pleased to present this exciting redevelopment opportunity including a newly renovated 8,000 SF 4 unit apartment building, and the former St. Josaphat church. The church is an outstanding 40,000 SF building with large lower level classrooms which has been approved for at least 15+ apartments. Current parcel includes 4 unit apartment building with integral parking option, church, and newly paved parking lot. Apartment building currently grosses $109,020 annually.
Highlights
Multifamily redevelopment with opportunity to complete 15-31 additional apartments
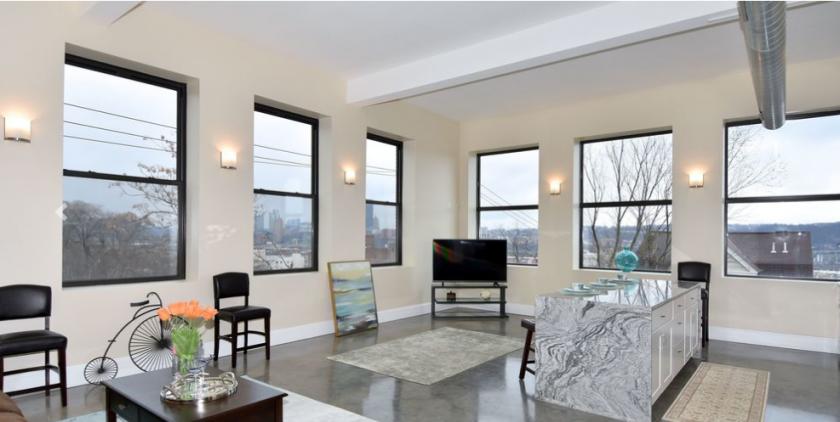
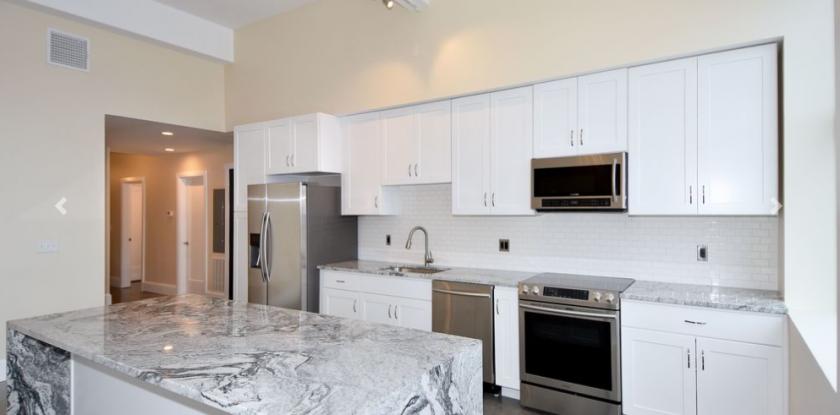
8,000 SF schoolhouse with 4 finished units, rooftop deck and option for 11-car integral parking lot
40,000 SF church- redevelopment opportunity
Newly paved 17-car concrete parking lot- contiguous to church
Amazing hilltop views of Downtown Pittsburgh and Oakland.
Easy access to and from city
Conveniently located off 18th St adjacent to South Side park
Lower levels provide great floor plates for apartments and/or amenities!
No part of this information may be copied, reproduced, repurposed, or screen-captured for any commercial purpose without prior written authorization from MyEListing.
While we strive to provide the most accurate information, all listing information, and demographic data, is provided by third-parties. As such, MyEListing will not be responsible for the accuracy of the information. It is strongly recommended that you verify all information with the listing agent, and any relevant agencies, prior to making any decisions.
What is the asking price for 2301 Mission Street in Pittsburgh?
The asking price for 2301 Mission Street is $1,600,000
What is the building size of this Multifamily property in Pittsburgh, PA?
The size of the building/unit at 2301 Mission Street in Pittsburgh is 48,000 square feet
How much land does the Pittsburgh, PA property at 2301 Mission Street include?
2301 Mission Street in Pittsburgh includes 0.517 acres of land
What is the population within 1 mile of 2301 Mission Street in Pittsburgh?
The population within 1 mile of 2301 Mission Street Pittsburgh, PA 15203 is 19,386 people.
Who do I contact for questions about 2301 Mission Street?
You should contact the listing agent,
Melissa Maggi, for any details regarding this commercial listing.