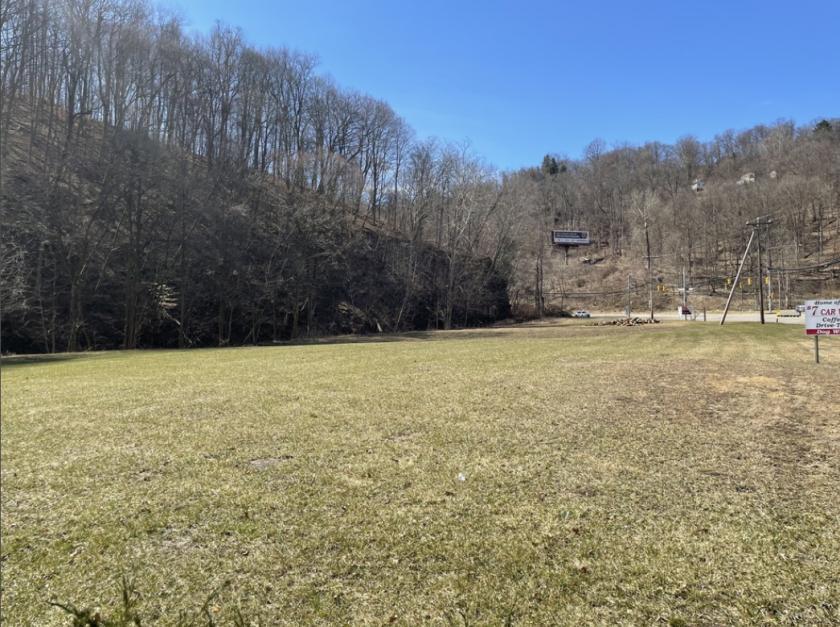
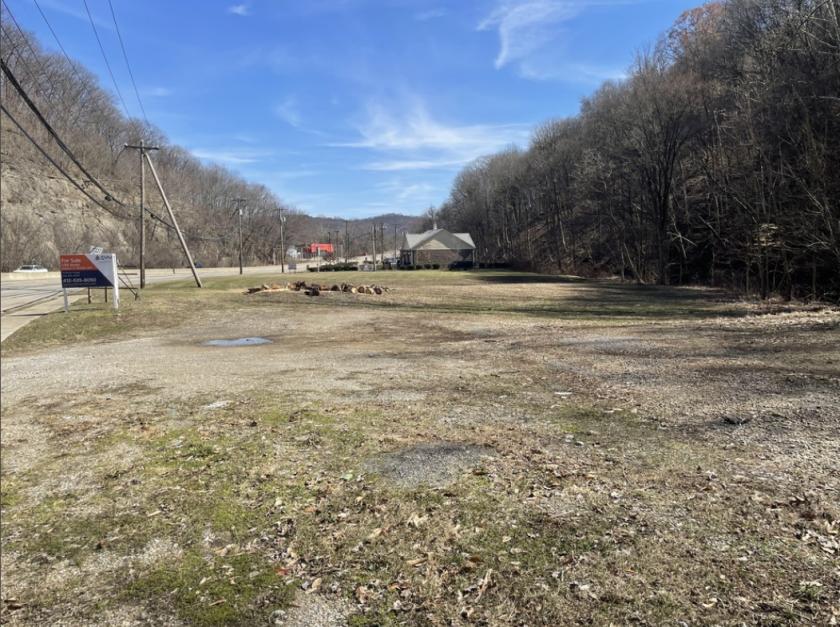
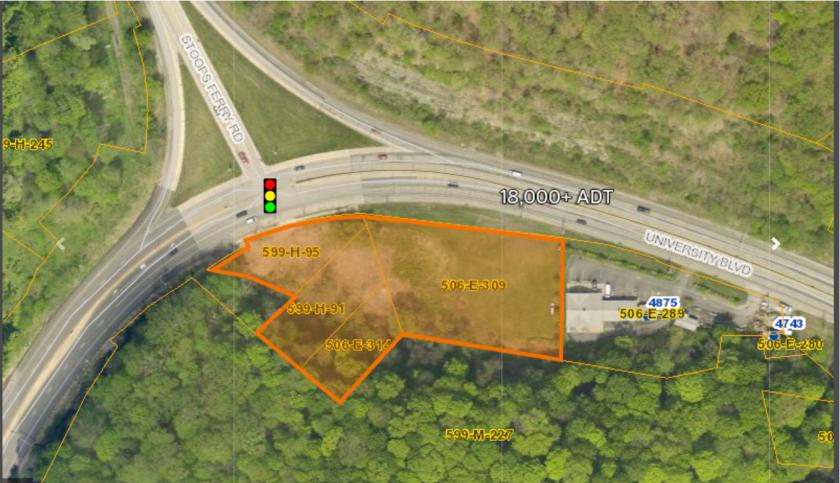
1-Mile | 3-Miles | 5-Miles | ||
---|---|---|---|---|
Total Population | 5,956 | 38,361 | 71,138 | |
Population Median Age | 42 | 41 | 41 | |
Population by Age | 0-9 Yrs | 555 (9%) | 3887 (10%) | 7496 (10%) |
10-19 Yrs | 784 (13%) | 5413 (14%) | 9211 (12%) | |
20-29 Yrs | 626 (10%) | 4514 (11%) | 8365 (11%) | |
30-39 Yrs | 745 (12%) | 4853 (12%) | 8913 (12%) | |
40-49 Yrs | 699 (11%) | 4601 (11%) | 8458 (11%) | |
50-59 Yrs | 939 (15%) | 5507 (14%) | 10724 (15%) | |
60-69 Yrs | 859 (14%) | 4785 (12%) | 8860 (12%) | |
70+ Yrs | 748 (12%) | 4802 (12%) | 9111 (12%) | |
Median HH Income | $80,168 | $71,373 | $69,495 | |
Total Household Income | < 24K | 245 (9%) | 2354 (14%) | 4516 (14%) |
25-49K | 498 (18%) | 3229 (19%) | 6215 (20%) | |
50-74K | 518 (19%) | 2988 (18%) | 5523 (18%) | |
75-99K | 310 (11%) | 1942 (11%) | 3687 (12%) | |
100-199K | 666 (25%) | 4009 (24%) | 7354 (24%) | |
200K+ | 414 (15%) | 1784 (10%) | 2885 (9%) | |
Highest Education Level | No Diploma | 128 | 1272 | 2615 |
Diploma or GED | 642 | 5529 | 12290 | |
Some College | 494 | 3986 | 8473 | |
Assoc. Degree | 376 | 2764 | 5212 | |
Bachelors Degree | 1574 | 8293 | 13938 | |
Higher Degree | 1059 | 4893 | 7942 | |
Total Housing Units | 2,846 | 17,934 | 33,637 | |
--Owner-Occupied | 1,891 | 11,257 | 21,194 | |
--Renter-Occupied | 760 | 5,049 | 8,986 | |
Owner-Occupied Values | < 100K | 192 | 2154 | 4846 |
100-199K | 394 | 3386 | 7010 | |
200-299K | 582 | 2574 | 4046 | |
300-399K | 204 | 1370 | 2504 | |
400-499K | 116 | 587 | 949 | |
500K+ | 403 | 1185 | 1839 | |
Total Working Age Population | 4,942 | 31,653 | 58,501 | |
In Work Force | 3,205 | 20,861 | 38,368 | |
Not In Work Force | 1,736 | 10,792 | 20,133 | |
Workforce Employed | 3,129 | 19,990 | 36,844 | |
Workforce Unemployed | 72 | 791 | 1,427 | |
Civlian Workforce | 3,201 | 20,781 | 38,271 | |
Military Workforce | 4 | 80 | 97 | |
Total Households | 2,651 | 16,306 | 30,179 | |
Family Households | 1,583 | 9,852 | 18,671 | |
Non-Family Households | 1,068 | 6,454 | 11,508 | |
Married Couple | 1,323 | 7,921 | 14,560 | |
Other Family | 260 | 1,930 | 4,111 | |
Married w/Child | 516 | 3,176 | 5,549 | |
Single Male w/Child | 44 | 337 | 795 | |
Single Female w/Child | 99 | 700 | 1,326 |
Population Change Last Two Decades - Plus Projection
2000 | % | 2010 | % | 2020 | % | 2030 | |
---|---|---|---|---|---|---|---|
Pennsylvania | 12,281,054 | +3 | 12,702,379 | +4 | 13,230,170 | +4 | 13,759,594 |
Allegheny County | 1,281,666 | -5 | 1,223,348 | +3 | 1,265,919 | +3 | 1,307,654 |
Beaver County | 181,412 | -6 | 170,539 | +1 | 172,348 | +1 | 174,352 |
Washington County | 202,897 | +2 | 207,820 | 0 | 206,942 | 0 | 207,065 |
Total Working Age Population:
Total Households:
Total Working Age Population:
Total Households:
Total Working Age Population:
Total Households: