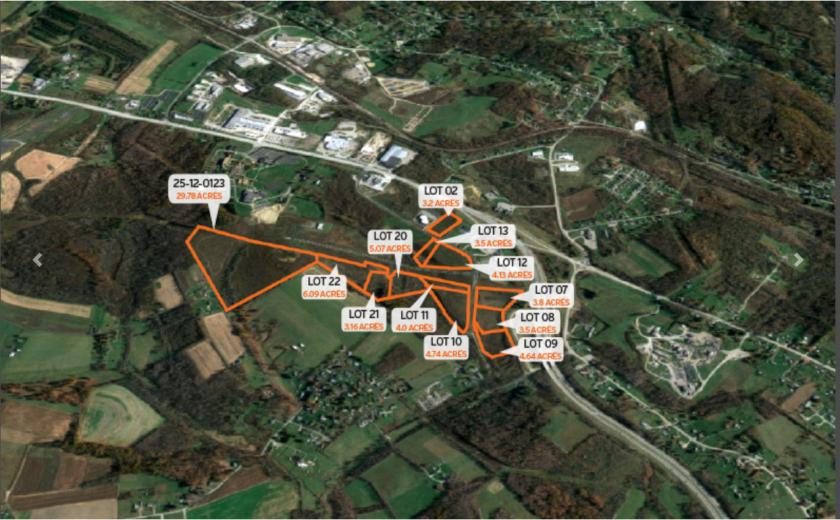
1-Mile | 3-Miles | 5-Miles | ||
---|---|---|---|---|
Total Population | 810 | 7,907 | 27,786 | |
Population Median Age | 47 | 45 | 43 | |
Population by Age | 0-9 Yrs | 56 (6%) | 758 (9%) | 3070 (11%) |
10-19 Yrs | 90 (11%) | 831 (10%) | 2797 (10%) | |
20-29 Yrs | 76 (9%) | 755 (9%) | 3354 (12%) | |
30-39 Yrs | 43 (5%) | 703 (8%) | 3276 (11%) | |
40-49 Yrs | 125 (15%) | 973 (12%) | 3091 (11%) | |
50-59 Yrs | 152 (18%) | 1475 (18%) | 4055 (14%) | |
60-69 Yrs | 137 (16%) | 1181 (14%) | 3972 (14%) | |
70+ Yrs | 131 (16%) | 1230 (15%) | 4172 (15%) | |
Median HH Income | $50,825 | $44,175 | $40,558 | |
Total Household Income | < 24K | 105 (27%) | 1067 (29%) | 3843 (31%) |
25-49K | 81 (21%) | 956 (26%) | 3307 (27%) | |
50-74K | 90 (23%) | 664 (18%) | 1997 (16%) | |
75-99K | 39 (10%) | 388 (10%) | 1368 (11%) | |
100-199K | 64 (16%) | 486 (13%) | 1489 (12%) | |
200K+ | 0 (0%) | 71 (1%) | 205 (1%) | |
Highest Education Level | No Diploma | 41 | 541 | 2288 |
Diploma or GED | 356 | 3391 | 10213 | |
Some College | 90 | 771 | 3032 | |
Assoc. Degree | 53 | 477 | 1784 | |
Bachelors Degree | 57 | 526 | 2214 | |
Higher Degree | 28 | 259 | 965 | |
Total Housing Units | 418 | 4,094 | 14,061 | |
--Owner-Occupied | 296 | 2,719 | 8,310 | |
--Renter-Occupied | 82 | 913 | 3,899 | |
Owner-Occupied Values | < 100K | 137 | 1494 | 4714 |
100-199K | 105 | 821 | 2617 | |
200-299K | 36 | 227 | 600 | |
300-399K | 14 | 103 | 229 | |
400-499K | 2 | 47 | 79 | |
500K+ | 1 | 28 | 71 | |
Total Working Age Population | 730 | 6,785 | 23,089 | |
In Work Force | 359 | 3,581 | 12,325 | |
Not In Work Force | 371 | 3,203 | 10,764 | |
Workforce Employed | 329 | 3,315 | 11,257 | |
Workforce Unemployed | 30 | 260 | 1,045 | |
Civlian Workforce | 359 | 3,575 | 12,302 | |
Military Workforce | 0 | 7 | 23 | |
Total Households | 377 | 3,632 | 12,209 | |
Family Households | 232 | 2,087 | 6,696 | |
Non-Family Households | 146 | 1,545 | 5,514 | |
Married Couple | 152 | 1,447 | 4,408 | |
Other Family | 80 | 640 | 2,288 | |
Married w/Child | 43 | 453 | 1,573 | |
Single Male w/Child | 1 | 29 | 157 | |
Single Female w/Child | 16 | 211 | 800 |
Population Change Last Two Decades - Plus Projection
2000 | % | 2010 | % | 2020 | % | 2030 | |
---|---|---|---|---|---|---|---|
Pennsylvania | 12,281,054 | +3 | 12,702,379 | +4 | 13,230,170 | +4 | 13,759,594 |
Fayette County | 148,644 | -8 | 136,606 | +1 | 137,756 | +2 | 139,981 |
Total Working Age Population:
Total Households:
Total Working Age Population:
Total Households:
Total Working Age Population:
Total Households: