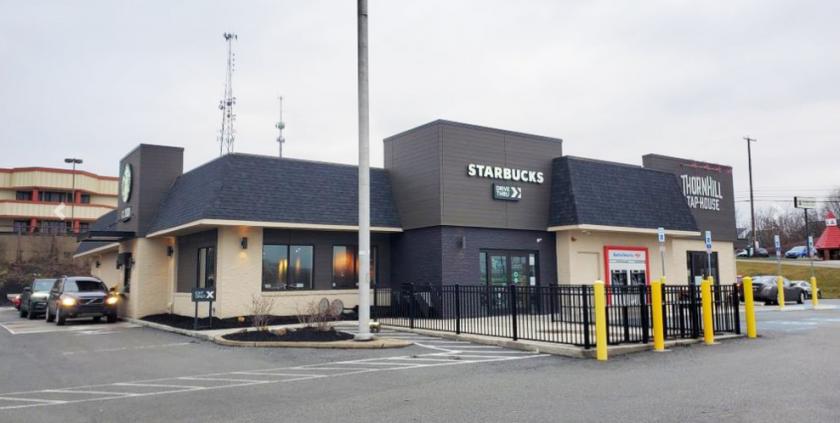
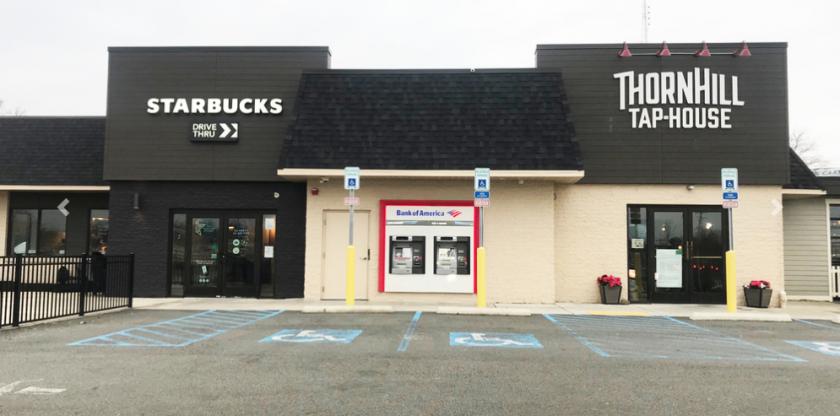
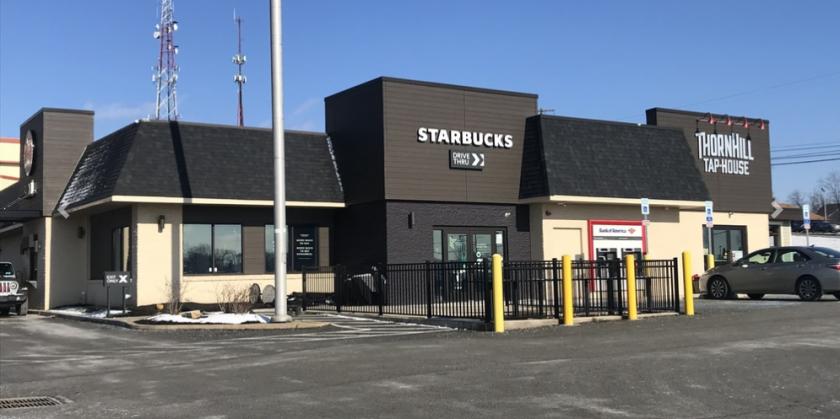
1-Mile | 3-Miles | 5-Miles | ||
---|---|---|---|---|
Total Population | 3,647 | 26,439 | 69,362 | |
Population Median Age | 41 | 39 | 40 | |
Population by Age | 0-9 Yrs | 432 (11%) | 3375 (12%) | 8530 (12%) |
10-19 Yrs | 575 (15%) | 4064 (15%) | 9406 (13%) | |
20-29 Yrs | 172 (4%) | 1699 (6%) | 5294 (7%) | |
30-39 Yrs | 370 (10%) | 3071 (11%) | 8594 (12%) | |
40-49 Yrs | 577 (15%) | 4390 (16%) | 10306 (14%) | |
50-59 Yrs | 622 (17%) | 4305 (16%) | 10915 (15%) | |
60-69 Yrs | 595 (16%) | 3361 (12%) | 9253 (13%) | |
70+ Yrs | 305 (8%) | 2175 (8%) | 7063 (10%) | |
Median HH Income | $115,340 | $118,927 | $111,617 | |
Total Household Income | < 24K | 97 (7%) | 620 (6%) | 2088 (7%) |
25-49K | 114 (8%) | 956 (9%) | 2968 (11%) | |
50-74K | 196 (14%) | 1396 (14%) | 3820 (14%) | |
75-99K | 165 (12%) | 1181 (11%) | 3203 (11%) | |
100-199K | 472 (34%) | 3187 (32%) | 8778 (32%) | |
200K+ | 321 (23%) | 2614 (26%) | 5963 (22%) | |
Highest Education Level | No Diploma | 51 | 258 | 1058 |
Diploma or GED | 316 | 2212 | 7417 | |
Some College | 252 | 2010 | 5907 | |
Assoc. Degree | 133 | 1172 | 3629 | |
Bachelors Degree | 915 | 6724 | 17029 | |
Higher Degree | 908 | 5981 | 14176 | |
Total Housing Units | 1,448 | 10,438 | 28,142 | |
--Owner-Occupied | 1,228 | 8,313 | 22,509 | |
--Renter-Occupied | 137 | 1,641 | 4,312 | |
Owner-Occupied Values | < 100K | 44 | 265 | 1042 |
100-199K | 156 | 989 | 4106 | |
200-299K | 317 | 2013 | 5977 | |
300-399K | 335 | 2314 | 5081 | |
400-499K | 246 | 1585 | 3037 | |
500K+ | 130 | 1148 | 3267 | |
Total Working Age Population | 2,822 | 20,400 | 54,778 | |
In Work Force | 1,942 | 14,190 | 37,424 | |
Not In Work Force | 880 | 6,209 | 17,354 | |
Workforce Employed | 1,852 | 13,657 | 36,211 | |
Workforce Unemployed | 91 | 533 | 1,202 | |
Civlian Workforce | 1,942 | 14,190 | 37,413 | |
Military Workforce | 0 | 0 | 11 | |
Total Households | 1,364 | 9,954 | 26,820 | |
Family Households | 1,057 | 7,495 | 19,619 | |
Non-Family Households | 308 | 2,459 | 7,202 | |
Married Couple | 959 | 6,740 | 17,476 | |
Other Family | 98 | 755 | 2,143 | |
Married w/Child | 440 | 3,311 | 7,987 | |
Single Male w/Child | 8 | 151 | 353 | |
Single Female w/Child | 31 | 216 | 666 |
Population Change Last Two Decades - Plus Projection
2000 | % | 2010 | % | 2020 | % | 2030 | |
---|---|---|---|---|---|---|---|
Pennsylvania | 12,281,054 | +3 | 12,702,379 | +4 | 13,230,170 | +4 | 13,759,594 |
Allegheny County | 1,281,666 | -5 | 1,223,348 | +3 | 1,265,919 | +3 | 1,307,654 |
Beaver County | 181,412 | -6 | 170,539 | +1 | 172,348 | +1 | 174,352 |
Butler County | 174,083 | +6 | 183,862 | +4 | 190,619 | +4 | 197,650 |
Total Working Age Population:
Total Households:
Total Working Age Population:
Total Households:
Total Working Age Population:
Total Households: