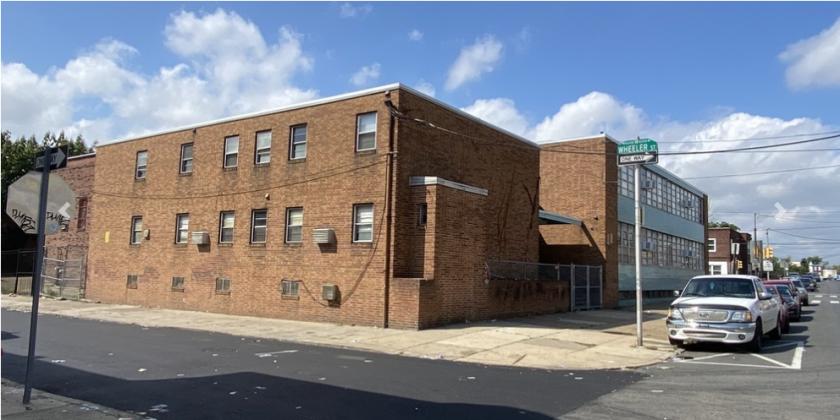
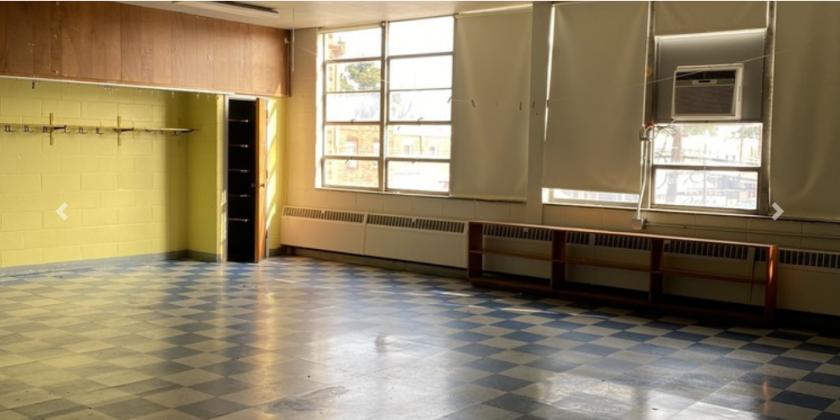
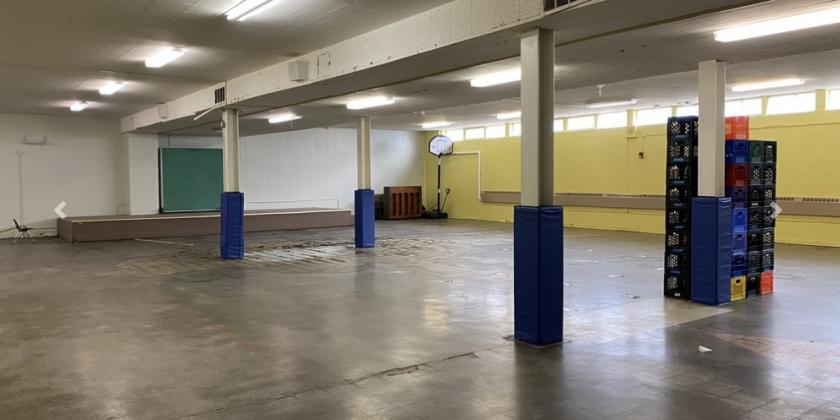
Former Thomas Morton Elementary School Annex building in the Elmwood Park section of Philadelphia. Originally designed to accommodate a small learning environment, the layout includes classrooms on two floors, a cafeteria on the lower level and systems room in the basement -- all in good working order. Abuting the school is a former convent with offices/classrooms throughout and a kitchen on the upper level.
Highlights
2-story school with classrooms, offices, cafeteria and multi-purpose room
2-story former convent with add'l offices and classrooms
Situated in Urban Setting, close to commercial corridors on Woodland Ave, Lindburgh Blvd & Pennrose Shopping Center
Access to public transportation, including Septa trolley/buses, I-76 & I-95
Less than 10 mins from Philadelphia International Airport
Ideal for continued use as an educational facility or re-develop to accommodate various commercial mixed-uses in a pedestrian-friendly environment (including Multi-family Residential; Daycare; Healthcare Ctr; Retail; Restaurant)
No part of this information may be copied, reproduced, repurposed, or screen-captured for any commercial purpose without prior written authorization from MyEListing.
While we strive to provide the most accurate information, all listing information, and demographic data, is provided by third-parties. As such, MyEListing will not be responsible for the accuracy of the information. It is strongly recommended that you verify all information with the listing agent, and any relevant agencies, prior to making any decisions.
What is the asking price for 2414 South 62nd Street in Philadelphia?
The asking price for 2414 South 62nd Street is $425,000
What is the building size of this Specialty property in Philadelphia, PA?
The size of the building/unit at 2414 South 62nd Street in Philadelphia is 17,981 square feet
How much land does the Philadelphia, PA property at 2414 South 62nd Street include?
2414 South 62nd Street in Philadelphia includes 0.201 acres of land
What kind of Specialty is the propery at 2414 South 62nd Street?
The property at 2414 South 62nd Street Philadelphia, PA 19142 is listed as a Education/Day Care Specialty property
What is the population within 1 mile of 2414 South 62nd Street in Philadelphia?
The population within 1 mile of 2414 South 62nd Street Philadelphia, PA 19142 is 43,676 people.
Who do I contact for questions about 2414 South 62nd Street?
You should contact the listing agent,
Lisa Edmonds, for any details regarding this commercial listing.