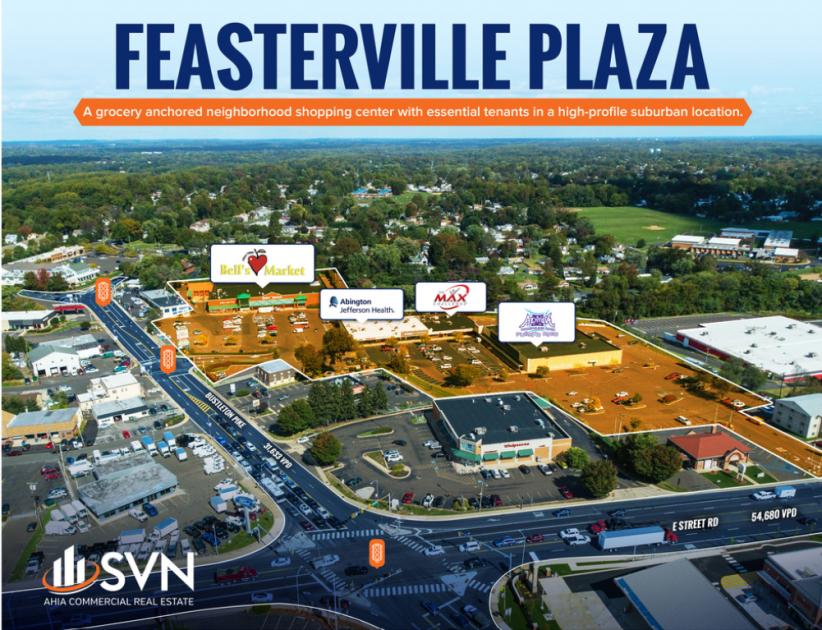
SVN is pleased to present Feasterville Plaza, a truly exceptional retail investment opportunity in the heart of Bucks County, a suburban Philadelphia sub-market. Feasterville Plaza is a 110,627 square foot, 13 in-place tenant neighborhood shopping center located in a highly desirable, affluent and densely populated location. Anchored by Bell’s Market, this shopping center offers a lineup of notable brands such as Altitude Trampoline, Abington Urgent Care, Hollywood Tanning, and Wings to Go.
Situated in a densely populated segment of the region, the asset is highly visible from its location at the intersection of Bustleton Pike and Street Road, which are among one of the most highly traveled in the MSA. There are more than 227,425 residents living within a five mile radius of the property with an average household income in excess of $83,000. The well established and diverse residential neighborhoods around the center create an attractive consumer profile and provide significant consumer buying power.
Highlights
Grocery anchored regional shopping center
Retail / redevelopment investment opportunity
Nearby to prominent signalized intersection
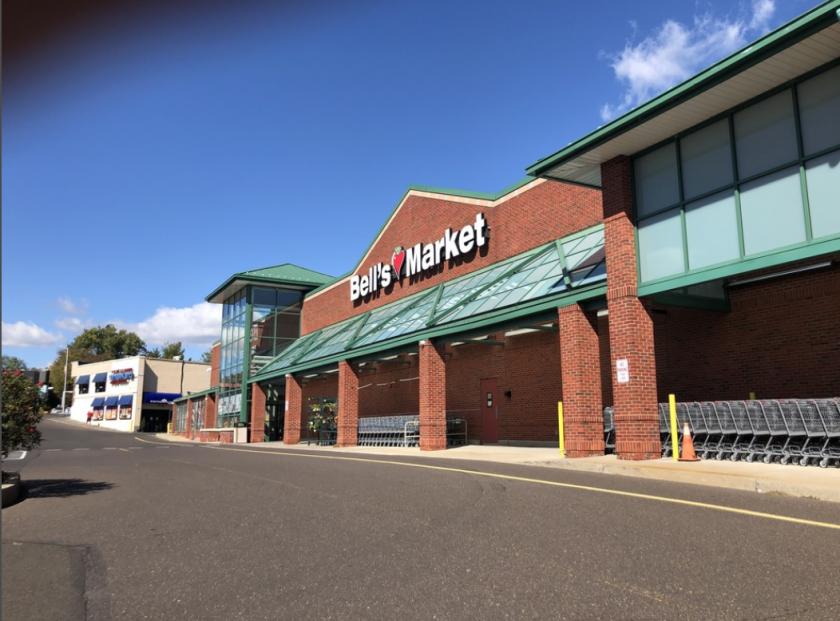
Anchored by Bell's Market - newly opened in 2020
110,627 SF gross leasable area
12.18 AC ± single parcel site
Designed with two freestanding buildings
Located in Lower Southampton Township, Suburban Philadelphia Market
Densely populated region
231,000 residents within a 5 mile radius
Amenities rich location
Easy access to Philadelphia, New Jersey and New York
Convenient to U.S Route 1 and Pennsylvania Turnpike