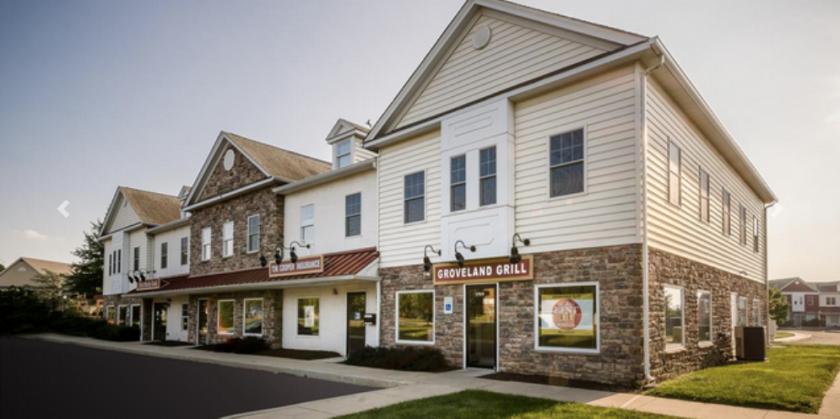
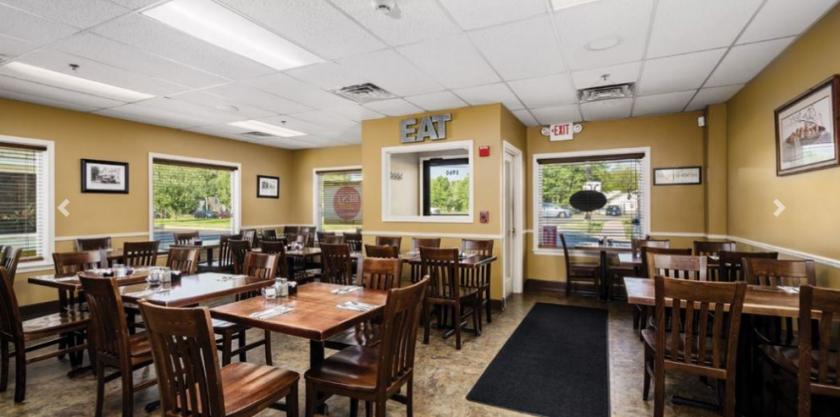
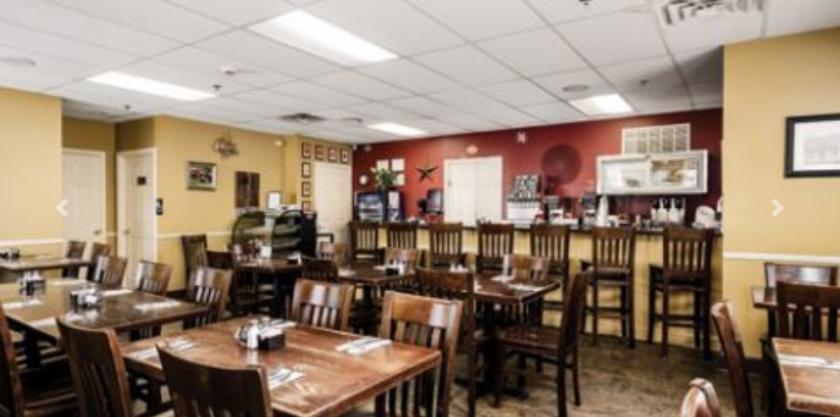
Turn-key breakfast and lunch cafe available for sale. Business and real estate included. Excellent location with exposure on Route 611 with high traffic volume. Extensive breakfast and lunch business. Excellent opportunity to generate additional income by adding dinner hours to the business. This well maintain restaurant space offers seating for up to 52 people with table and bar seats available. Excellent condition and turn-key. Fully equipped kitchen with 6-burner commercial stove, griddle, grill, deep fryer, Bay-Marie, double reach-ins, double wash sinks, triple dish sinks and refrigerators. Additional storage and ample parking is available. Condominium ownership provides for limited landlord's maintenance responsibilities.
Highlights
TURN-KEY Breakfast / Lunch Cafe
Real Estate and Business Included
Seating for 52 +
Table and Bar Seating
Fully-Equipped Kitchen
Extensive List of FF&E
Additional Storage Available
Excellent Location
High Traffic Volume
Mixed Residential & Commercial Neighborhood
Strong Demographic Profile
Ample Parking
Condominium Ownership with Limited Landlord's Responsibilities
Condo Fee Includes Snow Removal, Landscaping, Trash Removal, Dumpster, etc.
No part of this information may be copied, reproduced, repurposed, or screen-captured for any commercial purpose without prior written authorization from MyEListing.
While we strive to provide the most accurate information, all listing information, and demographic data, is provided by third-parties. As such, MyEListing will not be responsible for the accuracy of the information. It is strongly recommended that you verify all information with the listing agent, and any relevant agencies, prior to making any decisions.
What is the asking price for 5960 Easton Road in Plumsteadville?
The asking price for 5960 Easton Road is $395,000
What is the building size of this Retail property in Plumsteadville, PA?
The size of the building/unit at 5960 Easton Road in Plumsteadville is 1,477 square feet
What kind of Retail is the propery at 5960 Easton Road?
The property at 5960 Easton Road Plumsteadville, PA 18947 is listed as a Food Service Retail property
What is the population within 1 mile of 5960 Easton Road in Plumsteadville?
The population within 1 mile of 5960 Easton Road Plumsteadville, PA 18947 is 2,127 people.
Who do I contact for questions about 5960 Easton Road?
You should contact the listing agent,
Chichi Ahia, for any details regarding this commercial listing.