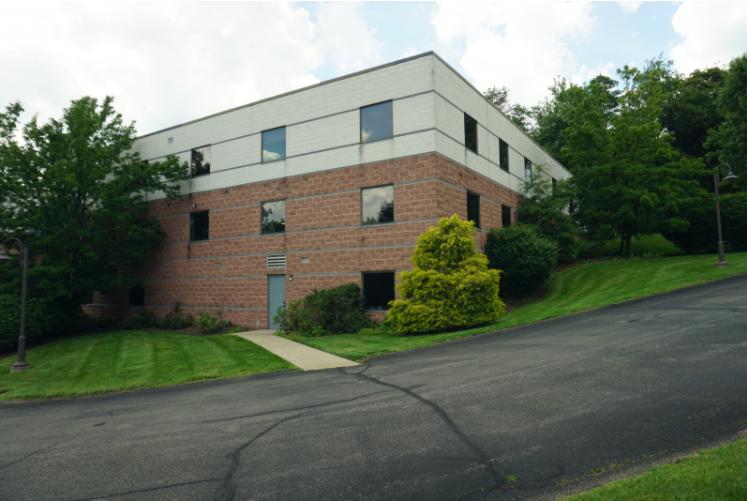
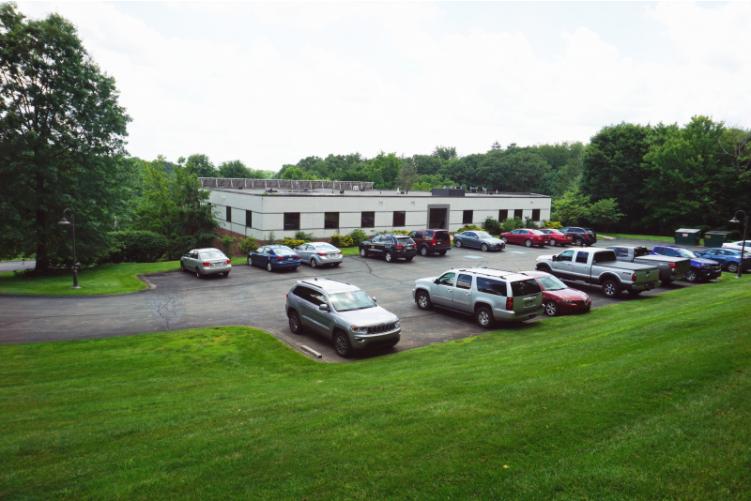
1-Mile | 3-Miles | 5-Miles | ||
---|---|---|---|---|
Total Population | 3,306 | 37,384 | 97,181 | |
Population Median Age | 44 | 43 | 43 | |
Population by Age | 0-9 Yrs | 409 (12%) | 4323 (11%) | 10296 (10%) |
10-19 Yrs | 393 (11%) | 4617 (12%) | 11038 (11%) | |
20-29 Yrs | 222 (6%) | 3382 (9%) | 9054 (9%) | |
30-39 Yrs | 278 (8%) | 4148 (11%) | 11674 (12%) | |
40-49 Yrs | 486 (14%) | 4522 (12%) | 11338 (11%) | |
50-59 Yrs | 492 (14%) | 5659 (15%) | 15402 (15%) | |
60-69 Yrs | 512 (15%) | 5386 (14%) | 13863 (14%) | |
70+ Yrs | 516 (15%) | 5347 (14%) | 14516 (14%) | |
Median HH Income | $88,404 | $89,354 | $88,865 | |
Total Household Income | < 24K | 183 (13%) | 1688 (11%) | 4747 (11%) |
25-49K | 229 (17%) | 2369 (15%) | 6056 (15%) | |
50-74K | 170 (12%) | 2253 (15%) | 6207 (15%) | |
75-99K | 158 (11%) | 2026 (13%) | 5556 (13%) | |
100-199K | 352 (26%) | 4807 (32%) | 12717 (31%) | |
200K+ | 241 (18%) | 1803 (12%) | 4899 (12%) | |
Highest Education Level | No Diploma | 67 | 610 | 2172 |
Diploma or GED | 527 | 6185 | 15728 | |
Some College | 262 | 3581 | 9775 | |
Assoc. Degree | 177 | 2607 | 6921 | |
Bachelors Degree | 719 | 8000 | 21369 | |
Higher Degree | 654 | 5963 | 16133 | |
Total Housing Units | 1,356 | 15,386 | 41,933 | |
--Owner-Occupied | 1,050 | 12,573 | 33,043 | |
--Renter-Occupied | 284 | 2,373 | 7,140 | |
Owner-Occupied Values | < 100K | 14 | 417 | 1748 |
100-199K | 276 | 4733 | 12691 | |
200-299K | 295 | 3894 | 10074 | |
300-399K | 239 | 1987 | 4369 | |
400-499K | 72 | 734 | 1828 | |
500K+ | 153 | 807 | 2332 | |
Total Working Age Population | 2,643 | 30,348 | 80,104 | |
In Work Force | 1,680 | 19,987 | 52,638 | |
Not In Work Force | 964 | 10,361 | 27,466 | |
Workforce Employed | 1,613 | 19,348 | 51,031 | |
Workforce Unemployed | 66 | 632 | 1,568 | |
Civlian Workforce | 1,680 | 19,980 | 52,598 | |
Military Workforce | 0 | 7 | 39 | |
Total Households | 1,333 | 14,946 | 40,182 | |
Family Households | 901 | 10,566 | 27,251 | |
Non-Family Households | 433 | 4,380 | 12,932 | |
Married Couple | 796 | 9,258 | 23,876 | |
Other Family | 104 | 1,308 | 3,375 | |
Married w/Child | 324 | 3,526 | 8,959 | |
Single Male w/Child | 9 | 158 | 367 | |
Single Female w/Child | 37 | 360 | 929 |
Population Change Last Two Decades - Plus Projection
2000 | % | 2010 | % | 2020 | % | 2030 | |
---|---|---|---|---|---|---|---|
Pennsylvania | 12,281,054 | +3 | 12,702,379 | +4 | 13,230,170 | +4 | 13,759,594 |
Allegheny County | 1,281,666 | -5 | 1,223,348 | +3 | 1,265,919 | +3 | 1,307,654 |
Westmoreland County | 369,993 | -1 | 365,169 | -2 | 358,574 | -1 | 354,298 |
Total Working Age Population:
Total Households:
Total Working Age Population:
Total Households:
Total Working Age Population:
Total Households: