Keystone Opportunity Zone Benefits Until 2023
Sublease availability of approx. 15,000 SF (divisible)
Reception area with waiting room; signage opportunity
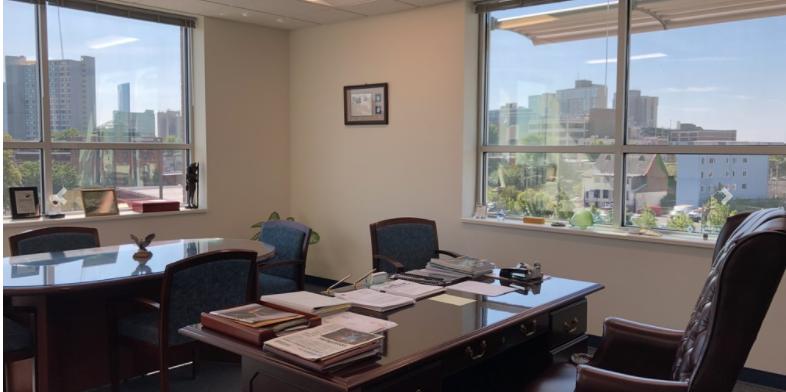
20 private offices; including 3 large executive offices
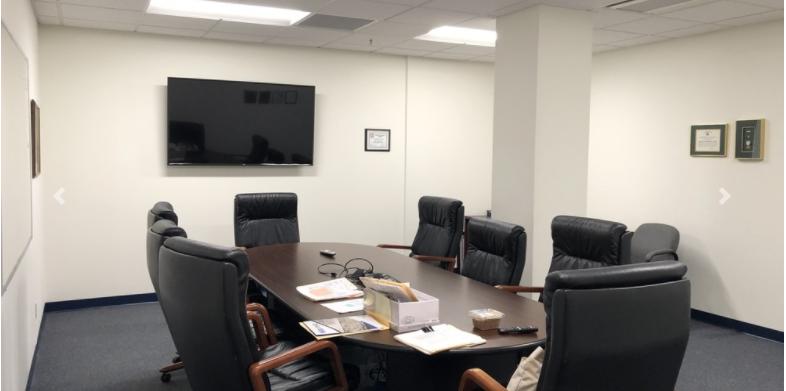
2 large conference rooms
1 large print and production center; 1 copy room
2 large rooms for bullpen/workstations
3 large storage rooms and 2 large dedicated file rooms
Kitchen and break area
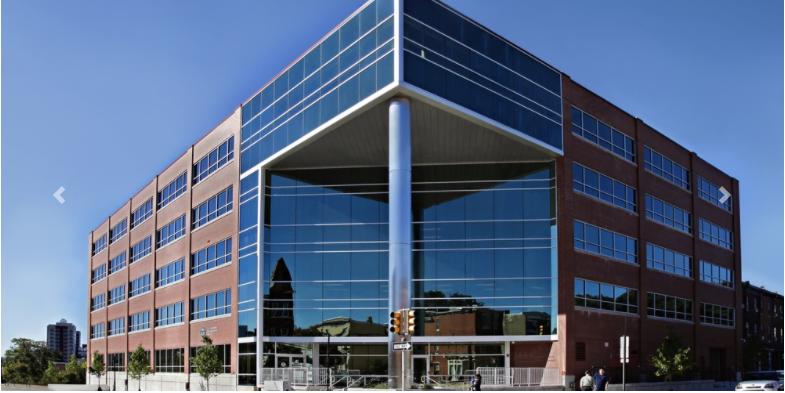
LEED Platinum office building - reducing tenant's energy costs by 33%
Tenant access to Rooftop Park
Conveniently located 1 block from SEPTA's El at 40th & Market St
No part of this information may be copied, reproduced, repurposed, or screen-captured for any commercial purpose without prior written authorization from MyEListing.
While we strive to provide the most accurate information, all listing information, and demographic data, is provided by third-parties. As such, MyEListing will not be responsible for the accuracy of the information. It is strongly recommended that you verify all information with the listing agent, and any relevant agencies, prior to making any decisions.
What is the asking price for 30 North 41st Street in Philadelphia?
The asking price for 30 North 41st Street is $31.00 a SF per Year
What is the building size of this commercial Office property?
The size of this lease property at '.30 North 41st Street.' is 15000 square feet
What kind of Office is the propery at 30 North 41st Street?
The property at 30 North 41st Street Philadelphia, PA 19104 is listed as a Professional Office property
What is the population within 1 mile of 30 North 41st Street in Philadelphia?
The population within 1 mile of 30 North 41st Street Philadelphia, PA 19104 is 67,239 people.
Who do I contact for questions about 30 North 41st Street?
You should contact the listing agent,
Tommy Choi, for any details regarding this commercial listing.