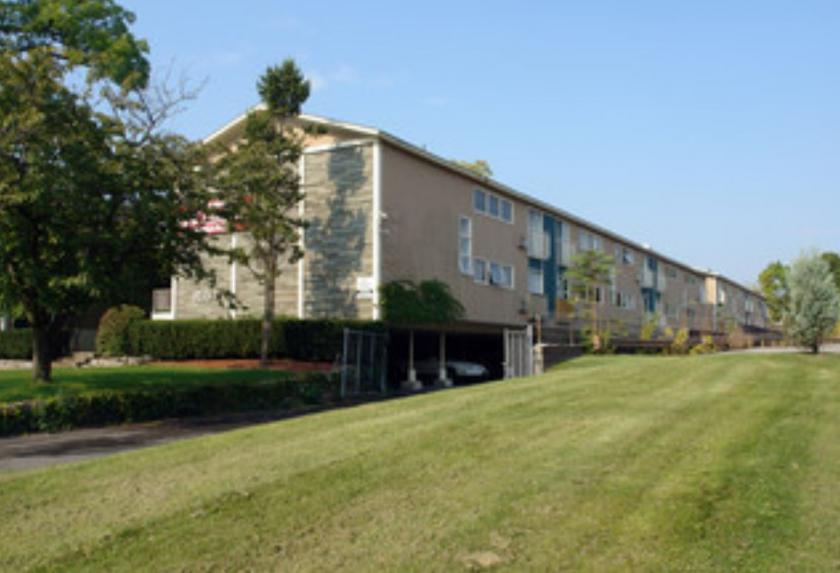
Multifamily Housing
1033 James Street Syracuse, NY 13203
1033 James Street Syracuse, NY 13203
Details & Description
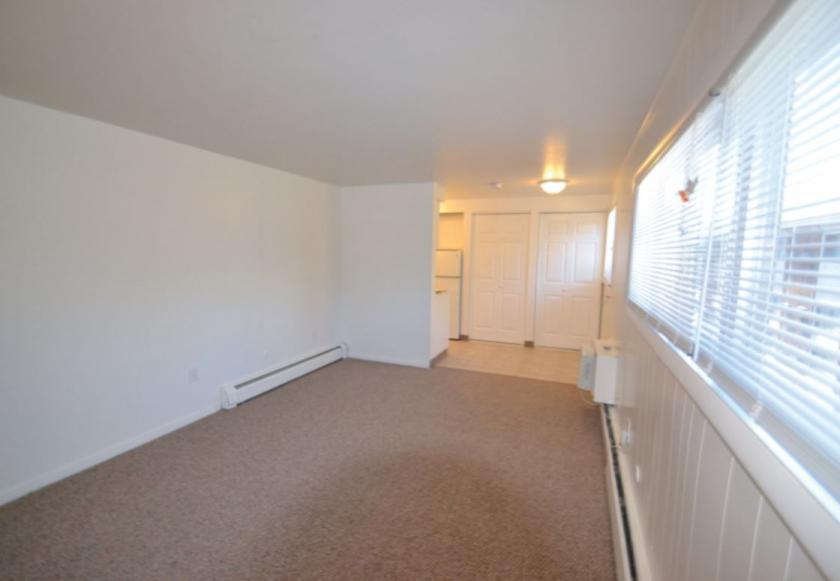
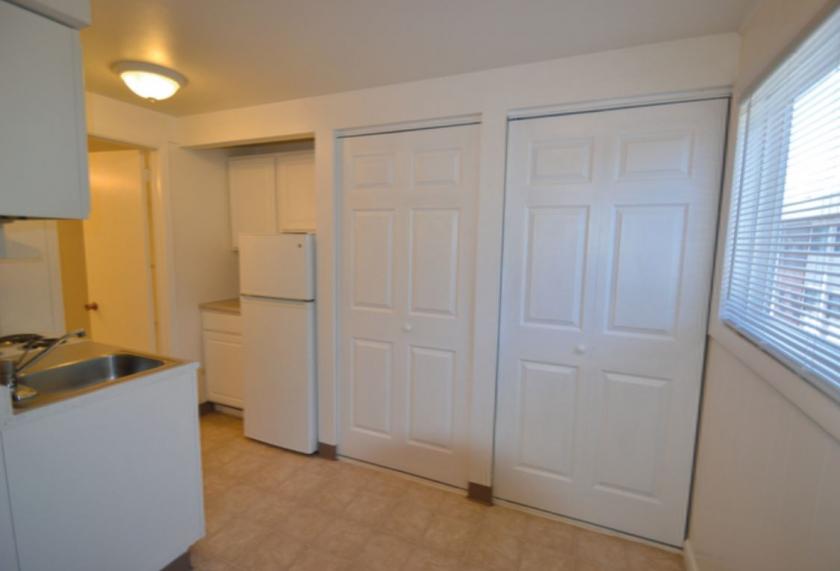
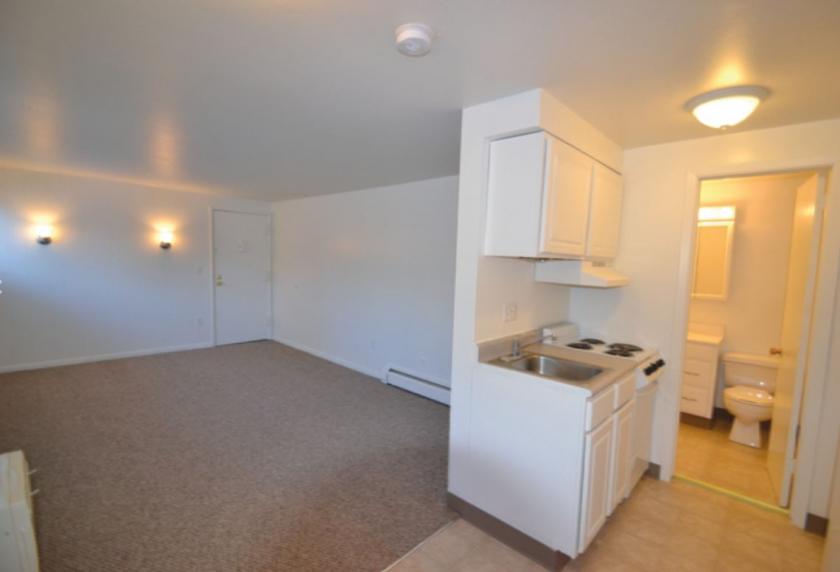
Additional Photos
Listing Agents

Steven Stoehrer
O: 929-343-5051
M: 646-389-2305
sstoehrer@svn.com
O: 929-343-5051
M: 646-389-2305
sstoehrer@svn.com
While we strive to provide the most accurate information, all listing information, and demographic data, is provided by third-parties. As such, MyEListing will not be responsible for the accuracy of the information. It is strongly recommended that you verify all information with the listing agent, and any relevant agencies, prior to making any decisions.


