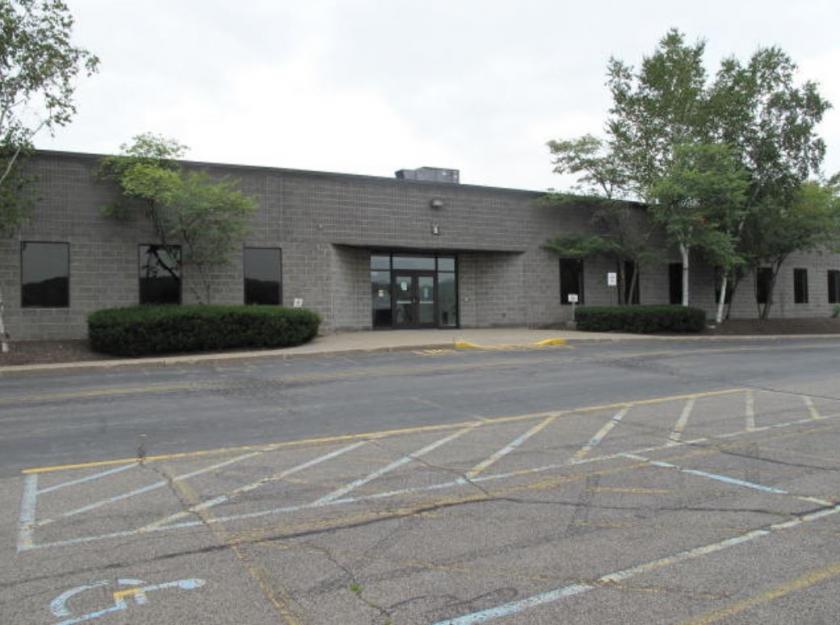
Office Space
521 Boices Lane Kingston, NY 12401
521 Boices Lane Kingston, NY 12401
Details & Description
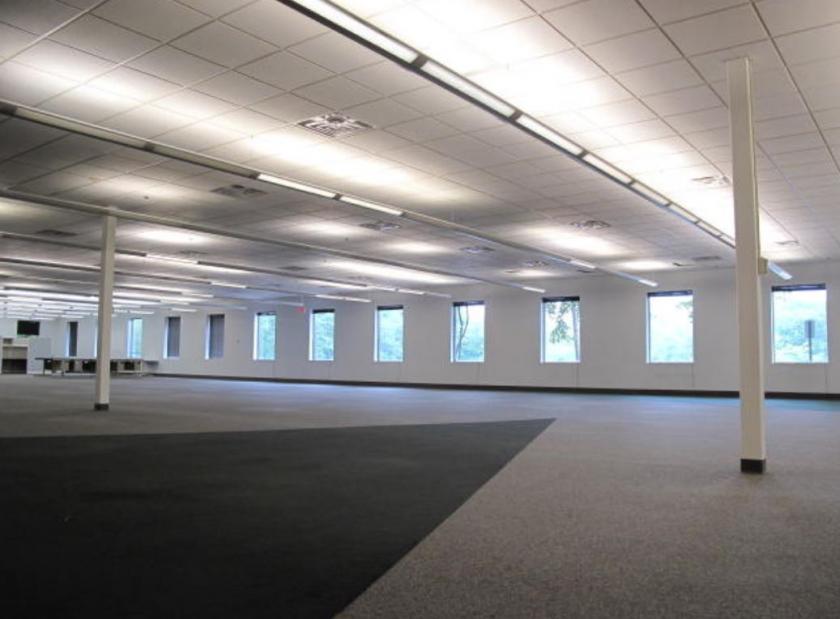
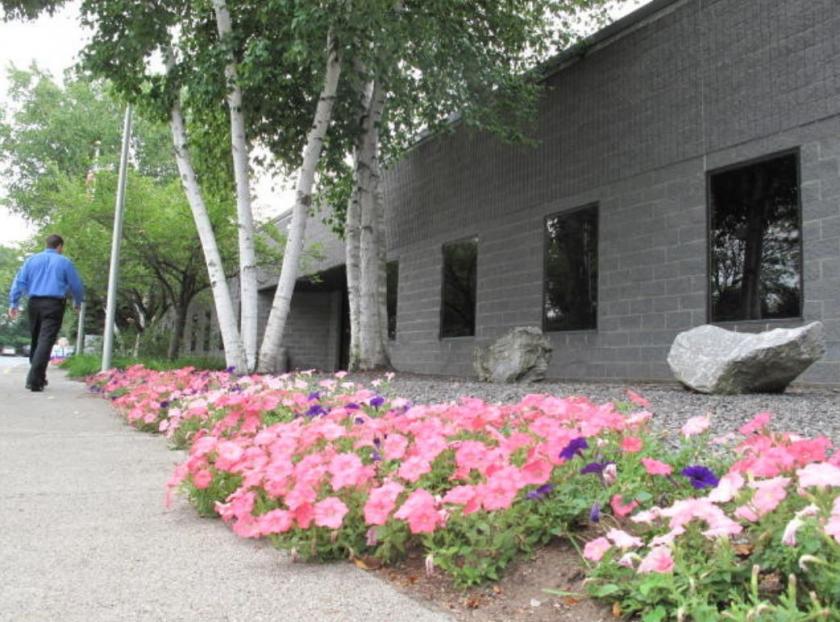
Additional Photos
Listing Agents

Joseph Deegan
O: 845-339-9100
joseph.deegan@svn.com
O: 845-339-9100
joseph.deegan@svn.com
While we strive to provide the most accurate information, all listing information, and demographic data, is provided by third-parties. As such, MyEListing will not be responsible for the accuracy of the information. It is strongly recommended that you verify all information with the listing agent, and any relevant agencies, prior to making any decisions.


