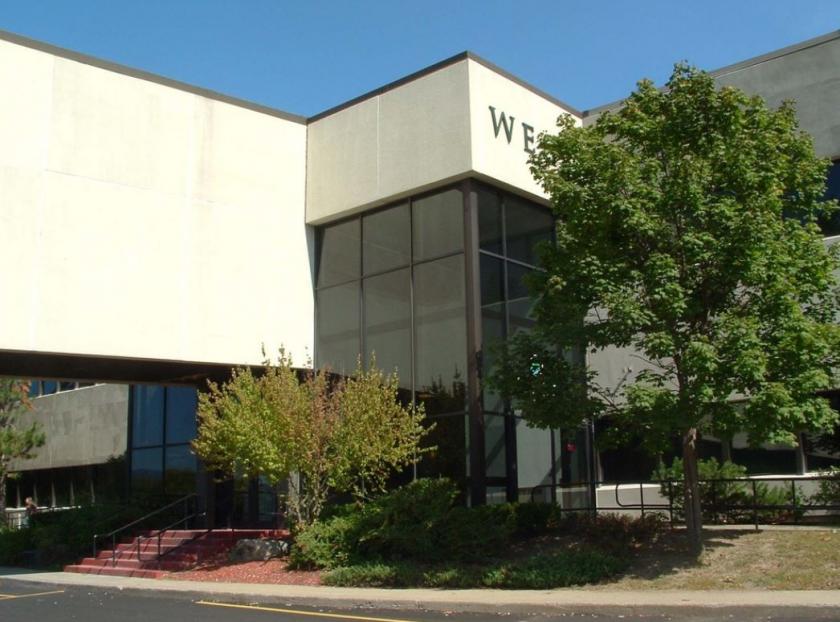
1-Mile | 3-Miles | 5-Miles | ||
---|---|---|---|---|
Total Population | 8,454 | 35,118 | 51,512 | |
Population Median Age | 37 | 41 | 43 | |
Population by Age | 0-9 Yrs | 1128 (13%) | 3802 (10%) | 5133 (9%) |
10-19 Yrs | 1115 (13%) | 3919 (11%) | 5538 (10%) | |
20-29 Yrs | 1149 (13%) | 4925 (14%) | 6565 (12%) | |
30-39 Yrs | 1356 (16%) | 4733 (13%) | 6431 (12%) | |
40-49 Yrs | 1029 (12%) | 3776 (10%) | 5691 (11%) | |
50-59 Yrs | 1171 (13%) | 5036 (14%) | 7751 (15%) | |
60-69 Yrs | 869 (10%) | 4508 (12%) | 7199 (13%) | |
70+ Yrs | 636 (7%) | 4418 (12%) | 7204 (13%) | |
Median HH Income | $49,480 | $52,541 | $57,450 | |
Total Household Income | < 24K | 894 (27%) | 3583 (25%) | 4495 (21%) |
25-49K | 745 (22%) | 3267 (22%) | 4753 (22%) | |
50-74K | 629 (19%) | 2732 (19%) | 3839 (18%) | |
75-99K | 312 (9%) | 1540 (10%) | 2452 (11%) | |
100-199K | 613 (18%) | 2614 (18%) | 4141 (19%) | |
200K+ | 57 (1%) | 587 (4%) | 1290 (6%) | |
Highest Education Level | No Diploma | 920 | 3187 | 4290 |
Diploma or GED | 2019 | 8428 | 12191 | |
Some College | 1038 | 4642 | 6614 | |
Assoc. Degree | 467 | 2378 | 3777 | |
Bachelors Degree | 749 | 3628 | 5784 | |
Higher Degree | 559 | 3205 | 5525 | |
Total Housing Units | 3,577 | 15,935 | 23,292 | |
--Owner-Occupied | 1,606 | 7,329 | 11,951 | |
--Renter-Occupied | 1,643 | 6,995 | 9,018 | |
Owner-Occupied Values | < 100K | 152 | 793 | 1181 |
100-199K | 913 | 3450 | 4651 | |
200-299K | 419 | 1976 | 3410 | |
300-399K | 88 | 632 | 1312 | |
400-499K | 18 | 214 | 577 | |
500K+ | 15 | 265 | 819 | |
Total Working Age Population | 6,611 | 28,809 | 43,062 | |
In Work Force | 4,424 | 18,186 | 26,713 | |
Not In Work Force | 2,187 | 10,623 | 16,349 | |
Workforce Employed | 4,076 | 16,935 | 25,126 | |
Workforce Unemployed | 337 | 1,193 | 1,517 | |
Civlian Workforce | 4,413 | 18,128 | 26,643 | |
Military Workforce | 11 | 58 | 70 | |
Total Households | 3,250 | 14,323 | 20,969 | |
Family Households | 1,937 | 8,000 | 11,894 | |
Non-Family Households | 1,313 | 6,323 | 9,075 | |
Married Couple | 1,155 | 5,261 | 8,285 | |
Other Family | 782 | 2,740 | 3,610 | |
Married w/Child | 491 | 1,926 | 2,746 | |
Single Male w/Child | 114 | 494 | 617 | |
Single Female w/Child | 356 | 1,012 | 1,317 |
Population Change Last Two Decades - Plus Projection
2000 | % | 2010 | % | 2020 | % | 2030 | |
---|---|---|---|---|---|---|---|
New York | 18,976,457 | +2 | 19,378,102 | +4 | 20,146,131 | +2 | 20,604,030 |
Columbia County | 63,094 | 0 | 63,096 | -5 | 59,939 | -5 | 57,200 |
Dutchess County | 280,150 | +6 | 297,488 | -2 | 292,936 | -1 | 290,338 |
Ulster County | 177,749 | +3 | 182,493 | -2 | 179,009 | -1 | 176,893 |
Total Working Age Population:
Total Households:
Total Working Age Population:
Total Households:
Total Working Age Population:
Total Households: