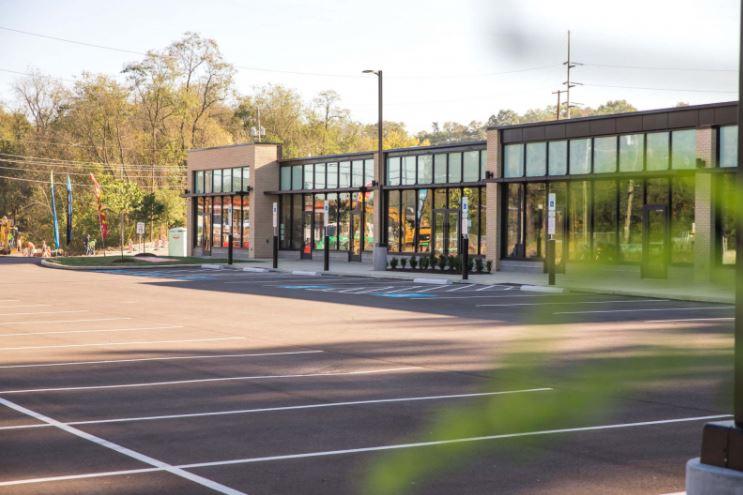
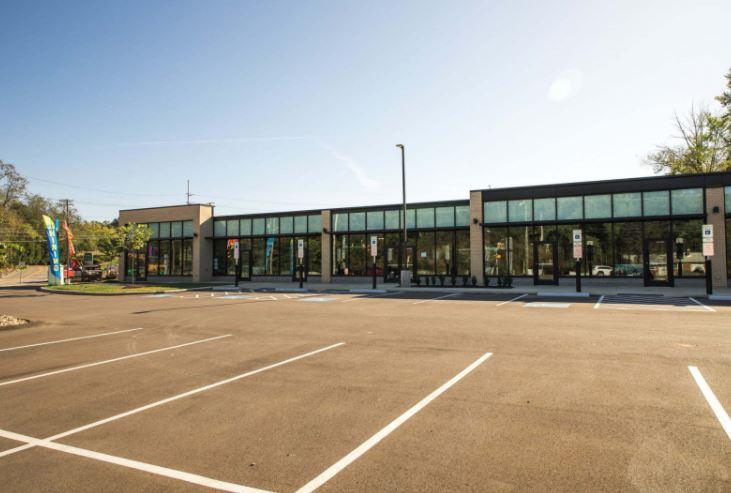
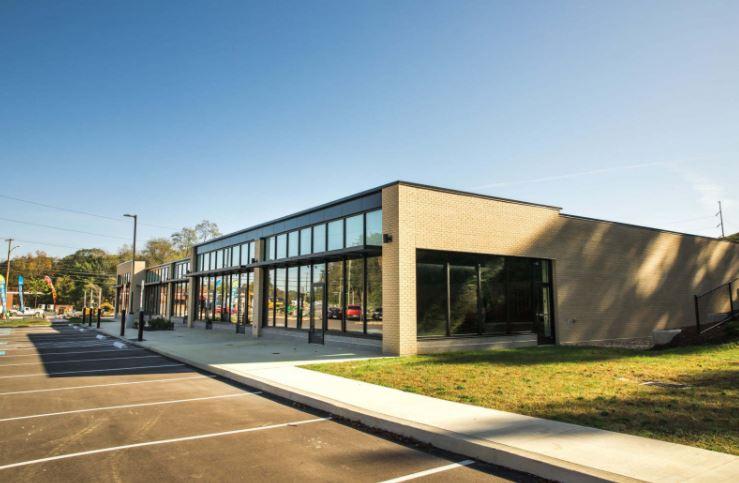
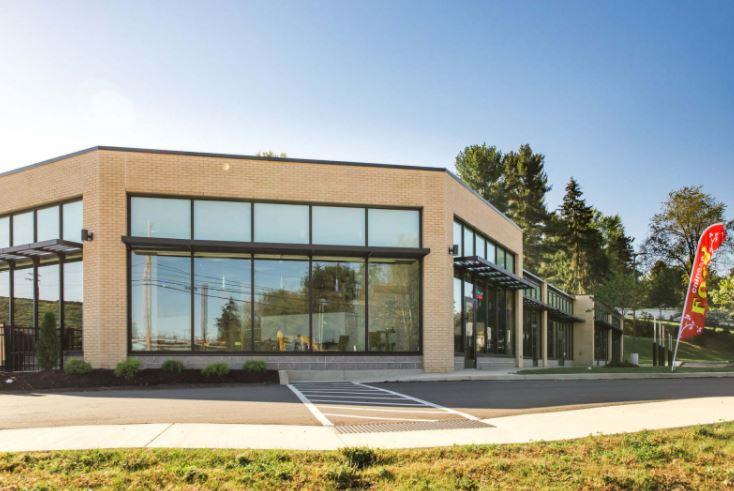
1-Mile | 3-Miles | 5-Miles | ||
---|---|---|---|---|
Total Population | 6,984 | 45,301 | 149,342 | |
Population Median Age | 42 | 43 | 42 | |
Population by Age | 0-9 Yrs | 718 (10%) | 4891 (10%) | 16635 (11%) |
10-19 Yrs | 965 (13%) | 6079 (13%) | 17782 (11%) | |
20-29 Yrs | 660 (9%) | 3462 (7%) | 13671 (9%) | |
30-39 Yrs | 848 (12%) | 5062 (11%) | 19203 (12%) | |
40-49 Yrs | 922 (13%) | 6101 (13%) | 19403 (12%) | |
50-59 Yrs | 1009 (14%) | 6948 (15%) | 21604 (14%) | |
60-69 Yrs | 836 (11%) | 5535 (12%) | 19969 (13%) | |
70+ Yrs | 1026 (14%) | 7221 (15%) | 21074 (14%) | |
Median HH Income | $68,426 | $87,656 | $83,820 | |
Total Household Income | < 24K | 654 (20%) | 2228 (11%) | 8117 (12%) |
25-49K | 527 (16%) | 3035 (16%) | 10439 (16%) | |
50-74K | 523 (16%) | 2958 (15%) | 10092 (15%) | |
75-99K | 448 (14%) | 2366 (12%) | 8887 (13%) | |
100-199K | 719 (22%) | 5361 (28%) | 18205 (28%) | |
200K+ | 274 (8%) | 2890 (15%) | 7828 (12%) | |
Highest Education Level | No Diploma | 235 | 1339 | 4382 |
Diploma or GED | 1150 | 6360 | 22412 | |
Some College | 726 | 4290 | 14901 | |
Assoc. Degree | 507 | 2658 | 8962 | |
Bachelors Degree | 1413 | 10609 | 34836 | |
Higher Degree | 1001 | 7638 | 24311 | |
Total Housing Units | 3,311 | 19,933 | 67,292 | |
--Owner-Occupied | 2,132 | 14,956 | 47,274 | |
--Renter-Occupied | 1,012 | 3,883 | 16,294 | |
Owner-Occupied Values | < 100K | 199 | 1116 | 4362 |
100-199K | 888 | 5013 | 16777 | |
200-299K | 582 | 4080 | 13389 | |
300-399K | 242 | 2258 | 6189 | |
400-499K | 138 | 1102 | 2785 | |
500K+ | 83 | 1387 | 3772 | |
Total Working Age Population | 5,624 | 36,398 | 120,762 | |
In Work Force | 3,729 | 22,883 | 78,867 | |
Not In Work Force | 1,895 | 13,515 | 41,895 | |
Workforce Employed | 3,560 | 22,066 | 76,019 | |
Workforce Unemployed | 167 | 765 | 2,752 | |
Civlian Workforce | 3,727 | 22,831 | 78,771 | |
Military Workforce | 2 | 52 | 97 | |
Total Households | 3,145 | 18,839 | 63,568 | |
Family Households | 1,786 | 12,282 | 40,962 | |
Non-Family Households | 1,359 | 6,557 | 22,606 | |
Married Couple | 1,348 | 10,265 | 33,720 | |
Other Family | 437 | 2,016 | 7,243 | |
Married w/Child | 565 | 4,405 | 13,718 | |
Single Male w/Child | 59 | 296 | 1,162 | |
Single Female w/Child | 158 | 690 | 2,450 |
Population Change Last Two Decades - Plus Projection
2000 | % | 2010 | % | 2020 | % | 2030 | |
---|---|---|---|---|---|---|---|
Pennsylvania | 12,281,054 | +3 | 12,702,379 | +4 | 13,230,170 | +4 | 13,759,594 |
Allegheny County | 1,281,666 | -5 | 1,223,348 | +3 | 1,265,919 | +3 | 1,307,654 |
Washington County | 202,897 | +2 | 207,820 | 0 | 206,942 | 0 | 207,065 |
Total Working Age Population:
Total Households:
Total Working Age Population:
Total Households:
Total Working Age Population:
Total Households: