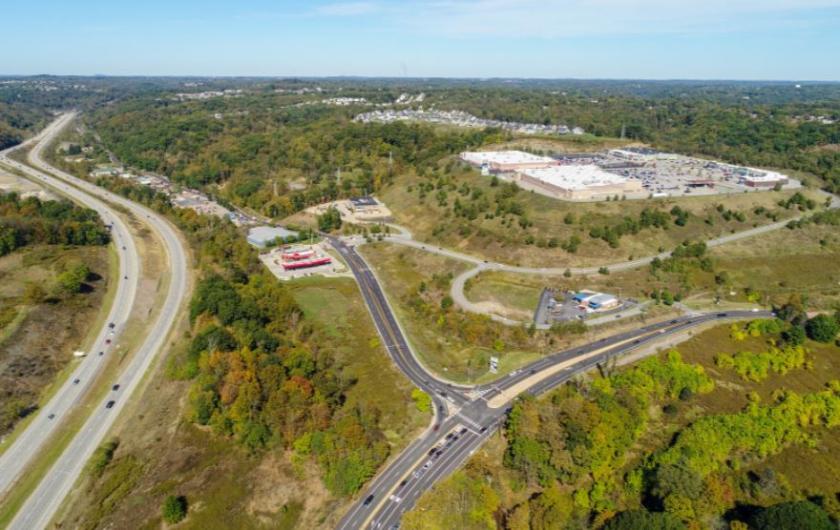
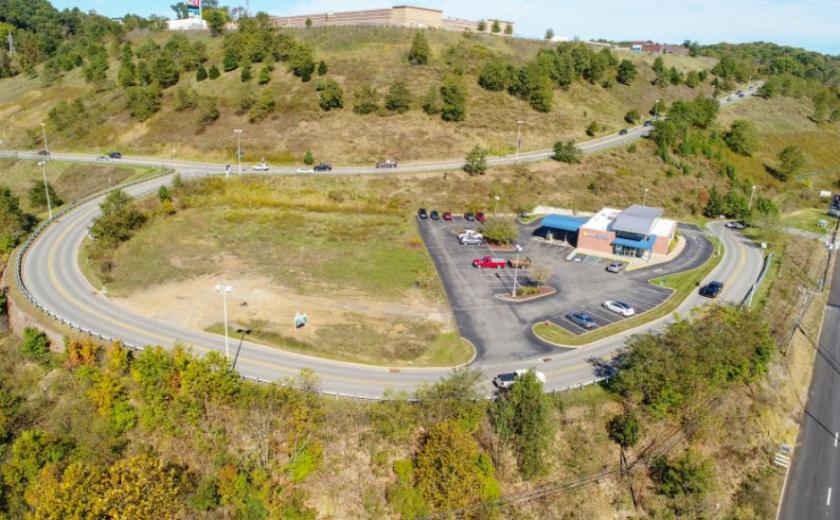
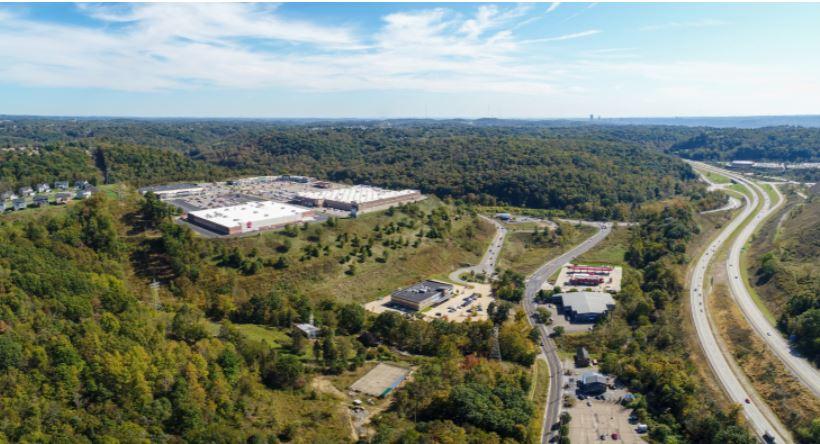
1-Mile | 3-Miles | 5-Miles | ||
---|---|---|---|---|
Total Population | 3,449 | 59,709 | 155,345 | |
Population Median Age | 36 | 42 | 42 | |
Population by Age | 0-9 Yrs | 643 (18%) | 6529 (10%) | 16944 (10%) |
10-19 Yrs | 336 (9%) | 5085 (8%) | 16233 (10%) | |
20-29 Yrs | 421 (12%) | 7692 (12%) | 19009 (12%) | |
30-39 Yrs | 557 (16%) | 9309 (15%) | 22059 (14%) | |
40-49 Yrs | 418 (12%) | 6681 (11%) | 18758 (12%) | |
50-59 Yrs | 364 (10%) | 8404 (14%) | 21770 (14%) | |
60-69 Yrs | 435 (12%) | 8512 (14%) | 20780 (13%) | |
70+ Yrs | 275 (7%) | 7497 (12%) | 19792 (12%) | |
Median HH Income | $127,197 | $68,096 | $67,745 | |
Total Household Income | < 24K | 95 (7%) | 4301 (15%) | 11619 (17%) |
25-49K | 122 (9%) | 5774 (20%) | 13319 (19%) | |
50-74K | 149 (11%) | 5013 (18%) | 12260 (18%) | |
75-99K | 152 (12%) | 3771 (13%) | 9247 (13%) | |
100-199K | 499 (39%) | 6670 (24%) | 16529 (24%) | |
200K+ | 240 (19%) | 2109 (7%) | 5046 (7%) | |
Highest Education Level | No Diploma | 66 | 2131 | 6249 |
Diploma or GED | 404 | 10813 | 29402 | |
Some College | 225 | 6957 | 17770 | |
Assoc. Degree | 171 | 4747 | 11722 | |
Bachelors Degree | 775 | 13022 | 30689 | |
Higher Degree | 729 | 7956 | 19429 | |
Total Housing Units | 1,377 | 30,031 | 74,410 | |
--Owner-Occupied | 1,009 | 18,629 | 47,117 | |
--Renter-Occupied | 247 | 9,009 | 20,904 | |
Owner-Occupied Values | < 100K | 22 | 2756 | 9064 |
100-199K | 265 | 8770 | 19306 | |
200-299K | 291 | 3868 | 10422 | |
300-399K | 211 | 1713 | 4469 | |
400-499K | 152 | 845 | 2065 | |
500K+ | 68 | 677 | 1791 | |
Total Working Age Population | 2,618 | 49,937 | 128,090 | |
In Work Force | 1,963 | 35,098 | 85,232 | |
Not In Work Force | 655 | 14,839 | 42,858 | |
Workforce Employed | 1,914 | 33,723 | 81,249 | |
Workforce Unemployed | 49 | 1,339 | 3,907 | |
Civlian Workforce | 1,963 | 35,063 | 85,156 | |
Military Workforce | 0 | 35 | 76 | |
Total Households | 1,257 | 27,638 | 68,021 | |
Family Households | 964 | 15,173 | 39,287 | |
Non-Family Households | 292 | 12,465 | 28,734 | |
Married Couple | 817 | 12,263 | 30,840 | |
Other Family | 148 | 2,910 | 8,447 | |
Married w/Child | 391 | 4,443 | 11,450 | |
Single Male w/Child | 11 | 363 | 816 | |
Single Female w/Child | 50 | 1,026 | 3,208 |
Population Change Last Two Decades - Plus Projection
2000 | % | 2010 | % | 2020 | % | 2030 | |
---|---|---|---|---|---|---|---|
Pennsylvania | 12,281,054 | +3 | 12,702,379 | +4 | 13,230,170 | +4 | 13,759,594 |
Allegheny County | 1,281,666 | -5 | 1,223,348 | +3 | 1,265,919 | +3 | 1,307,654 |
Beaver County | 181,412 | -6 | 170,539 | +1 | 172,348 | +1 | 174,352 |
Washington County | 202,897 | +2 | 207,820 | 0 | 206,942 | 0 | 207,065 |
Total Working Age Population:
Total Households:
Total Working Age Population:
Total Households:
Total Working Age Population:
Total Households: