Property Highlights
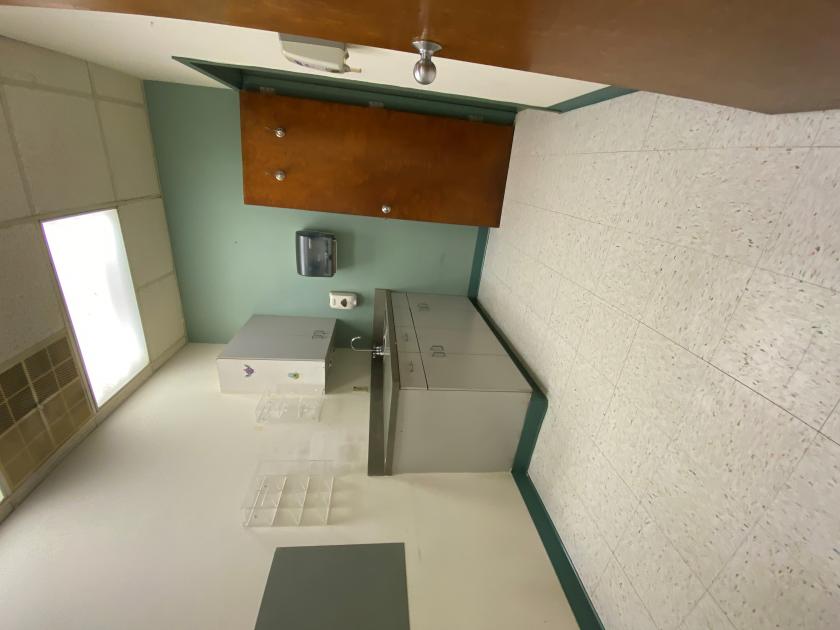
±3,000 SF Medical Office
Currently set up as a imaging center
Sufficient power source to accommodate MRI, CT scanners and other diagnostic equipment
Lead lined walls
Site is fully approved by the state to operate as a medical imaging center
Separate entrances for doctors and patients
On and off-street parking
Easy access to public transportation (one block from Orange train station)
Accessibility
Less Than 1 Mile to I-280
Approx. 2.09 Miles to Garden State Parkway
Approx. 6 Miles to I-78
Approx. 13 Miles to Newark Liberty International Airport
No part of this information may be copied, reproduced, repurposed, or screen-captured for any commercial purpose without prior written authorization from MyEListing.
While we strive to provide the most accurate information, all listing information, and demographic data, is provided by third-parties. As such, MyEListing will not be responsible for the accuracy of the information. It is strongly recommended that you verify all information with the listing agent, and any relevant agencies, prior to making any decisions.
What is the asking price for 345 Henry Street in City Of Orange?
The asking price for 345 Henry Street is $
What is the building size of this commercial Office property?
The size of this lease property at '.345 Henry Street.' is 1000 square feet
What kind of Office is the propery at 345 Henry Street?
The property at 345 Henry Street City Of Orange, NJ 07050 is listed as a Medical Office property
What is the population within 1 mile of 345 Henry Street in City Of Orange?
The population within 1 mile of 345 Henry Street City Of Orange, NJ 07050 is 45,619 people.
Who do I contact for questions about 345 Henry Street?
You should contact the listing agent,
Justyna Kuczaj, for any details regarding this commercial listing.