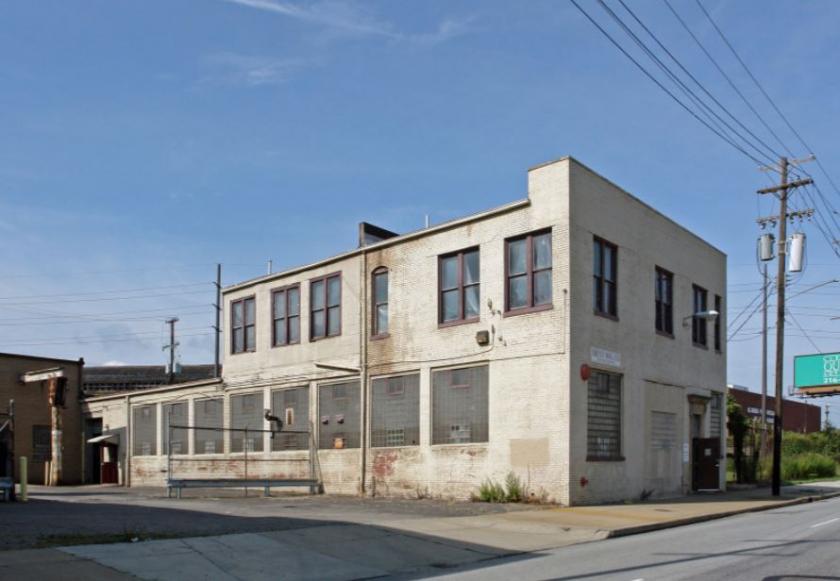
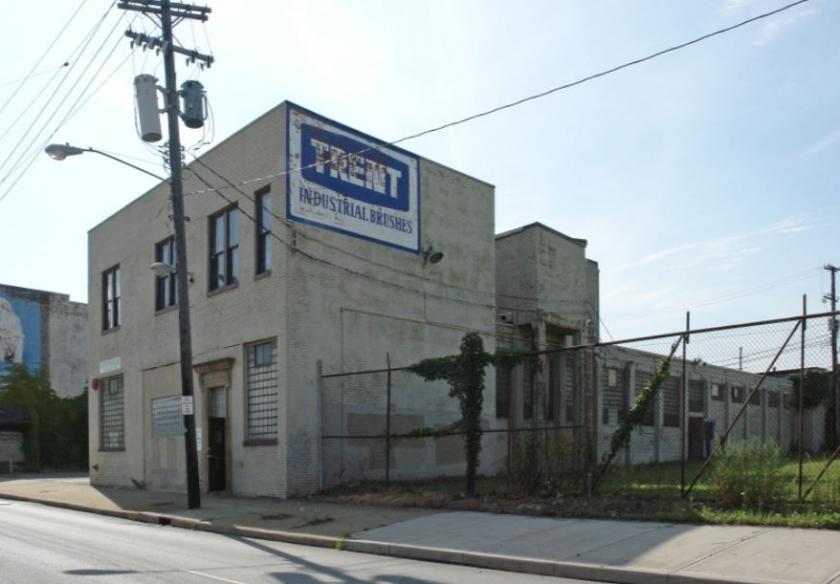
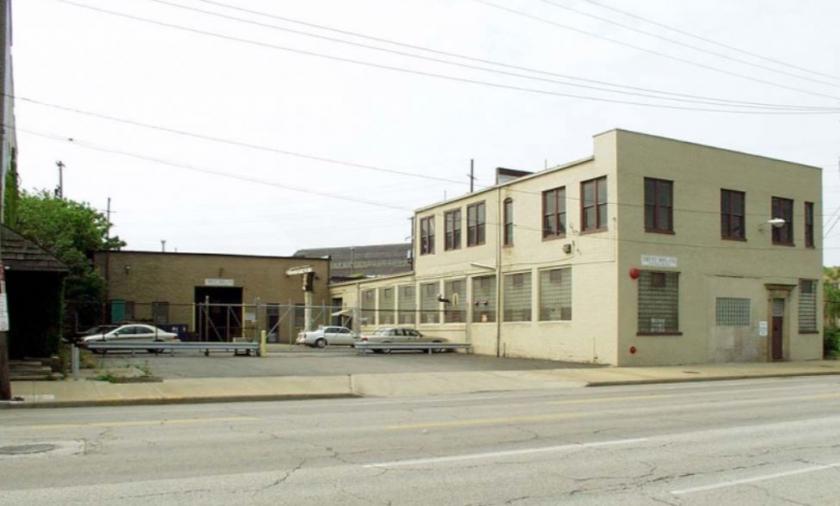
1-Mile | 3-Miles | 5-Miles | ||
---|---|---|---|---|
Total Population | 12,686 | 109,955 | 275,667 | |
Population Median Age | 36 | 36 | 38 | |
Population by Age | 0-9 Yrs | 2208 (17%) | 12986 (11%) | 32361 (11%) |
10-19 Yrs | 1472 (11%) | 12639 (11%) | 33079 (11%) | |
20-29 Yrs | 2073 (16%) | 25599 (23%) | 51141 (18%) | |
30-39 Yrs | 1498 (11%) | 14634 (13%) | 36419 (13%) | |
40-49 Yrs | 1291 (10%) | 10593 (9%) | 29312 (10%) | |
50-59 Yrs | 1663 (13%) | 13042 (11%) | 34746 (12%) | |
60-69 Yrs | 1309 (10%) | 11136 (10%) | 31707 (11%) | |
70+ Yrs | 1171 (9%) | 9326 (8%) | 26902 (9%) | |
Median HH Income | $17,326 | $25,370 | $30,410 | |
Total Household Income | < 24K | 3435 (63%) | 24509 (49%) | 53890 (43%) |
25-49K | 999 (18%) | 10641 (21%) | 29329 (23%) | |
50-74K | 562 (10%) | 5860 (11%) | 15721 (12%) | |
75-99K | 217 (3%) | 2933 (5%) | 9028 (7%) | |
100-199K | 171 (3%) | 4093 (8%) | 11248 (9%) | |
200K+ | 54 (0%) | 1405 (2%) | 4184 (3%) | |
Highest Education Level | No Diploma | 2238 | 14556 | 33387 |
Diploma or GED | 2505 | 19728 | 53099 | |
Some College | 1909 | 15690 | 40667 | |
Assoc. Degree | 504 | 4292 | 12444 | |
Bachelors Degree | 623 | 9261 | 24166 | |
Higher Degree | 279 | 7913 | 22178 | |
Total Housing Units | 6,799 | 64,511 | 161,375 | |
--Owner-Occupied | 1,416 | 13,214 | 45,287 | |
--Renter-Occupied | 4,023 | 36,226 | 78,115 | |
Owner-Occupied Values | < 100K | 894 | 8769 | 28371 |
100-199K | 350 | 2253 | 9273 | |
200-299K | 125 | 820 | 3303 | |
300-399K | 19 | 424 | 1785 | |
400-499K | 16 | 287 | 813 | |
500K+ | 11 | 661 | 1742 | |
Total Working Age Population | 9,502 | 90,571 | 224,602 | |
In Work Force | 5,034 | 49,576 | 128,225 | |
Not In Work Force | 4,469 | 40,995 | 96,378 | |
Workforce Employed | 3,889 | 42,108 | 110,683 | |
Workforce Unemployed | 1,144 | 7,456 | 17,467 | |
Civlian Workforce | 5,034 | 49,564 | 128,151 | |
Military Workforce | 0 | 12 | 74 | |
Total Households | 5,439 | 49,440 | 123,402 | |
Family Households | 2,505 | 19,754 | 56,882 | |
Non-Family Households | 2,934 | 29,687 | 66,519 | |
Married Couple | 664 | 6,989 | 23,924 | |
Other Family | 1,841 | 12,765 | 32,959 | |
Married w/Child | 194 | 1,699 | 7,195 | |
Single Male w/Child | 133 | 796 | 2,736 | |
Single Female w/Child | 1,032 | 6,731 | 15,369 |
Population Change Last Two Decades - Plus Projection
2000 | % | 2010 | % | 2020 | % | 2030 | |
---|---|---|---|---|---|---|---|
Ohio | 11,353,140 | +2 | 11,536,504 | 0 | 11,574,870 | 0 | 11,615,100 |
Cuyahoga County | 1,393,978 | -8 | 1,280,122 | -6 | 1,209,550 | -5 | 1,154,210 |
Total Working Age Population:
Total Households:
Total Working Age Population:
Total Households:
Total Working Age Population:
Total Households: