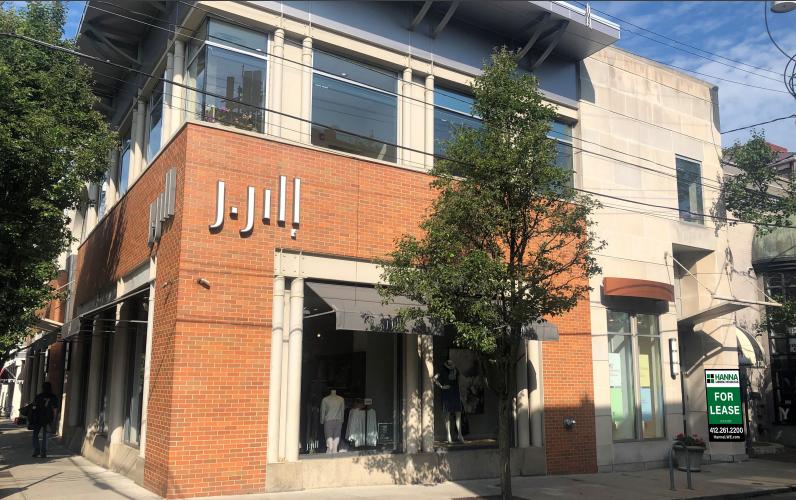
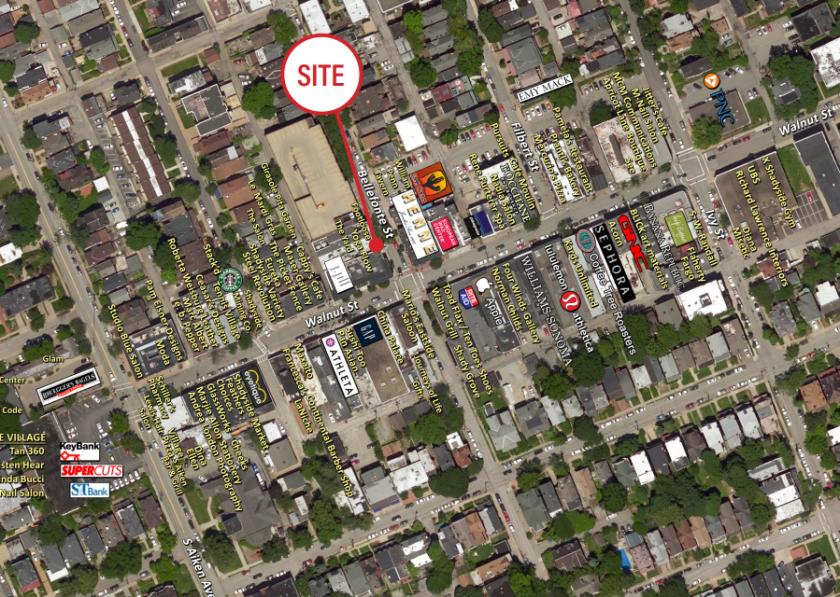
Walnut Street is arguably one of Pittsburgh’s
most well-recognized addresses and has
managed to retain its reputation as strong,
exclusive shopping destination for consumers,
despite the ongoing battle between traditional
retail and e-commerce. Anchored by an Apple
Store (one of three stores in the Pittsburgh
region) Walnut Street still demands some of the
highest retail rents within the City of Pittsburgh
and, despite this, features a diverse mix of retail
tenants; Banana Republic, LuLuLemon, and Gap
have a presences in Walnut Street alongside
locally-owned Pamela’s Diner, Nails on Walnut
and Coffee Tree Roasters.
No part of this information may be copied, reproduced, repurposed, or screen-captured for any commercial purpose without prior written authorization from MyEListing.
While we strive to provide the most accurate information, all listing information, and demographic data, is provided by third-parties. As such, MyEListing will not be responsible for the accuracy of the information. It is strongly recommended that you verify all information with the listing agent, and any relevant agencies, prior to making any decisions.
What is the asking price for 5433 Walnut Street in Pittsburgh?
The asking price for 5433 Walnut Street is $17.50 a SF per Year
What is the building size of this commercial Retail property?
The size of this lease property at '.5433 Walnut Street.' is 2075 square feet
What kind of Retail is the propery at 5433 Walnut Street?
The property at 5433 Walnut Street Pittsburgh, PA 15232 is listed as a Free Standing Building Retail property
What is the population within 1 mile of 5433 Walnut Street in Pittsburgh?
The population within 1 mile of 5433 Walnut Street Pittsburgh, PA 15232 is 37,833 people.
Who do I contact for questions about 5433 Walnut Street?
You should contact the listing agent,
Brian Kerr, for any details regarding this commercial listing.