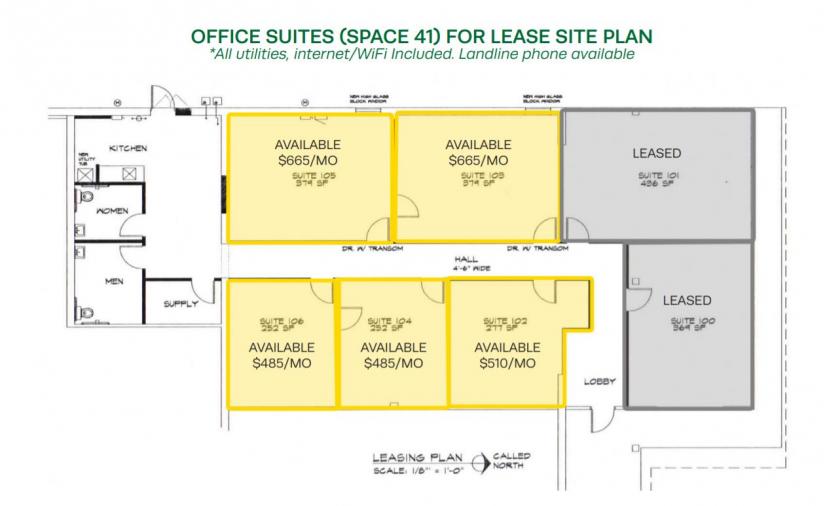
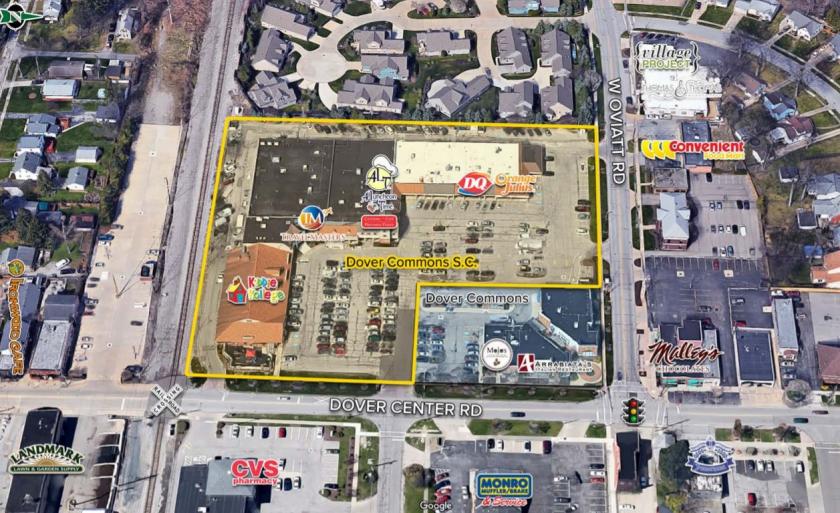
1-Mile | 3-Miles | 5-Miles | ||
---|---|---|---|---|
Total Population | 8,789 | 54,414 | 140,599 | |
Population Median Age | 40 | 43 | 42 | |
Population by Age | 0-9 Yrs | 1003 (11%) | 5987 (11%) | 15475 (11%) |
10-19 Yrs | 1397 (15%) | 6744 (12%) | 17958 (12%) | |
20-29 Yrs | 849 (9%) | 4699 (8%) | 13309 (9%) | |
30-39 Yrs | 982 (11%) | 5818 (10%) | 15607 (11%) | |
40-49 Yrs | 1387 (15%) | 7062 (12%) | 18825 (13%) | |
50-59 Yrs | 1148 (13%) | 8015 (14%) | 19945 (14%) | |
60-69 Yrs | 950 (10%) | 8012 (14%) | 19823 (14%) | |
70+ Yrs | 1073 (12%) | 8078 (14%) | 19657 (13%) | |
Median HH Income | $92,032 | $90,671 | $81,789 | |
Total Household Income | < 24K | 303 (8%) | 2353 (10%) | 7031 (12%) |
25-49K | 492 (13%) | 3520 (15%) | 10437 (17%) | |
50-74K | 575 (16%) | 3556 (15%) | 9803 (16%) | |
75-99K | 611 (17%) | 3232 (14%) | 7425 (12%) | |
100-199K | 1183 (33%) | 6701 (29%) | 16133 (27%) | |
200K+ | 410 (11%) | 3549 (15%) | 7745 (13%) | |
Highest Education Level | No Diploma | 190 | 1195 | 3893 |
Diploma or GED | 820 | 6102 | 18637 | |
Some College | 980 | 6588 | 18440 | |
Assoc. Degree | 301 | 2876 | 7576 | |
Bachelors Degree | 2484 | 13919 | 31359 | |
Higher Degree | 1313 | 8953 | 20987 | |
Total Housing Units | 3,768 | 24,519 | 62,419 | |
--Owner-Occupied | 2,711 | 18,052 | 44,658 | |
--Renter-Occupied | 864 | 4,859 | 13,917 | |
Owner-Occupied Values | < 100K | 100 | 1162 | 3701 |
100-199K | 1083 | 5400 | 16181 | |
200-299K | 816 | 5184 | 11028 | |
300-399K | 462 | 3154 | 6660 | |
400-499K | 70 | 1166 | 2941 | |
500K+ | 181 | 1987 | 4147 | |
Total Working Age Population | 6,905 | 43,999 | 113,287 | |
In Work Force | 4,823 | 28,480 | 73,751 | |
Not In Work Force | 2,083 | 15,519 | 39,537 | |
Workforce Employed | 4,694 | 27,679 | 71,463 | |
Workforce Unemployed | 123 | 796 | 2,274 | |
Civlian Workforce | 4,818 | 28,475 | 73,737 | |
Military Workforce | 5 | 5 | 14 | |
Total Households | 3,575 | 22,912 | 58,575 | |
Family Households | 2,372 | 14,491 | 37,083 | |
Non-Family Households | 1,203 | 8,421 | 21,492 | |
Married Couple | 1,847 | 12,082 | 30,655 | |
Other Family | 524 | 2,409 | 6,428 | |
Married w/Child | 831 | 4,723 | 12,414 | |
Single Male w/Child | 53 | 302 | 1,028 | |
Single Female w/Child | 219 | 856 | 2,056 |
Population Change Last Two Decades - Plus Projection
2000 | % | 2010 | % | 2020 | % | 2030 | |
---|---|---|---|---|---|---|---|
Ohio | 11,353,140 | +2 | 11,536,504 | 0 | 11,574,870 | 0 | 11,615,100 |
Cuyahoga County | 1,393,978 | -8 | 1,280,122 | -6 | 1,209,550 | -5 | 1,154,210 |
Lorain County | 284,664 | +6 | 301,356 | +3 | 310,230 | +3 | 320,430 |
Total Working Age Population:
Total Households:
Total Working Age Population:
Total Households:
Total Working Age Population:
Total Households: