Specialty Real Estate
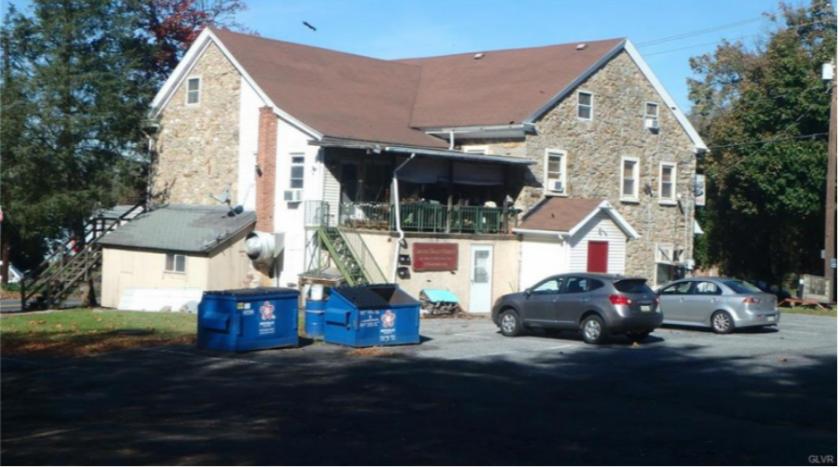
2006 Leithsville Road Hellertown, PA 18055
2006 Leithsville Road Hellertown, PA 18055
Details & Description
Listing Agents

Michael Gensey
M: 610-398-0411
MichaelGensey@HannaCRE.com
M: 610-398-0411
MichaelGensey@HannaCRE.com
While we strive to provide the most accurate information, all listing information, and demographic data, is provided by third-parties. As such, MyEListing will not be responsible for the accuracy of the information. It is strongly recommended that you verify all information with the listing agent, and any relevant agencies, prior to making any decisions.