Office Space
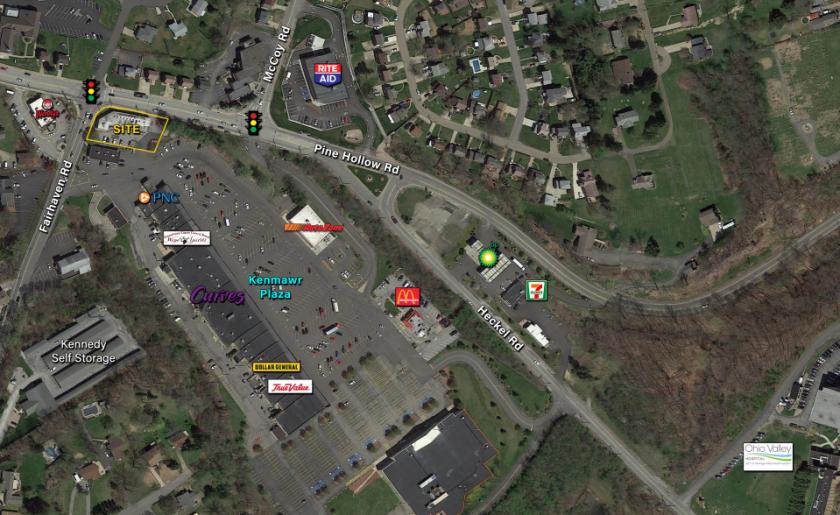
596 Pine Hollow Road McKees Rocks, PA 15136
596 Pine Hollow Road McKees Rocks, PA 15136
Details & Description
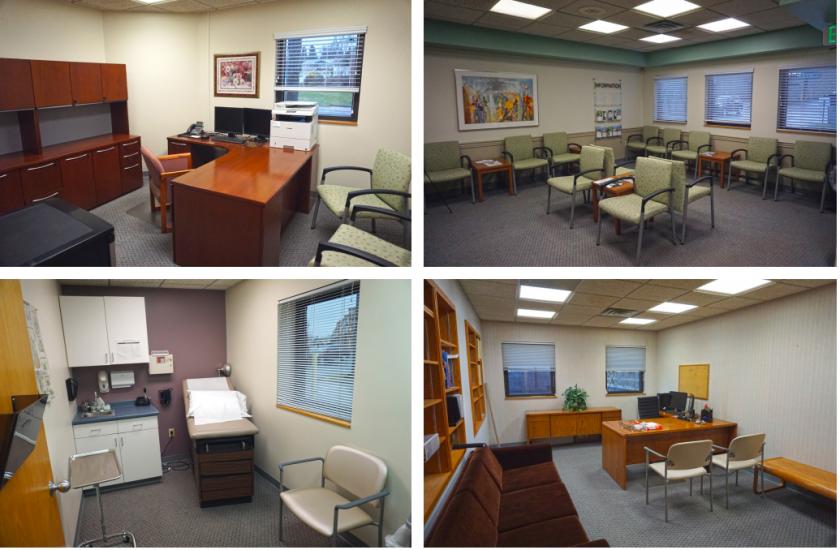
Additional Photos


Listing Agents

Sandra Cikovic
O: 412-261-2200
scikovic@HannaLWE.com
O: 412-261-2200
scikovic@HannaLWE.com

Gary Wilson
O: 412-261-2200
gwilson@HannaLWE.com
O: 412-261-2200
gwilson@HannaLWE.com
While we strive to provide the most accurate information, all listing information, and demographic data, is provided by third-parties. As such, MyEListing will not be responsible for the accuracy of the information. It is strongly recommended that you verify all information with the listing agent, and any relevant agencies, prior to making any decisions.


