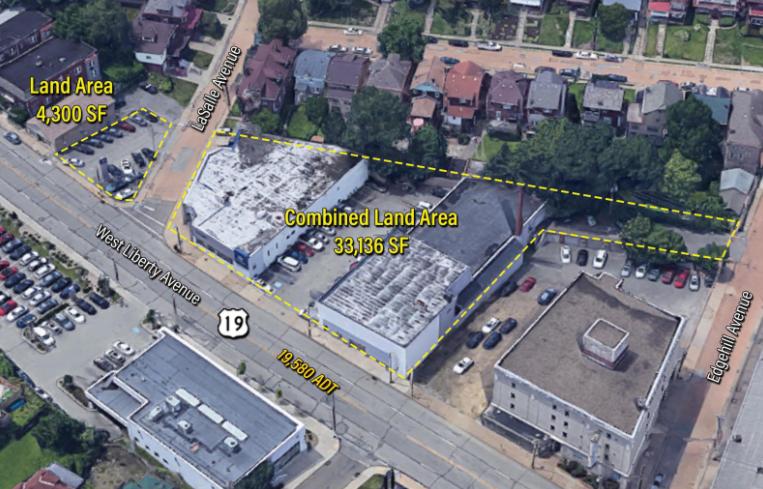
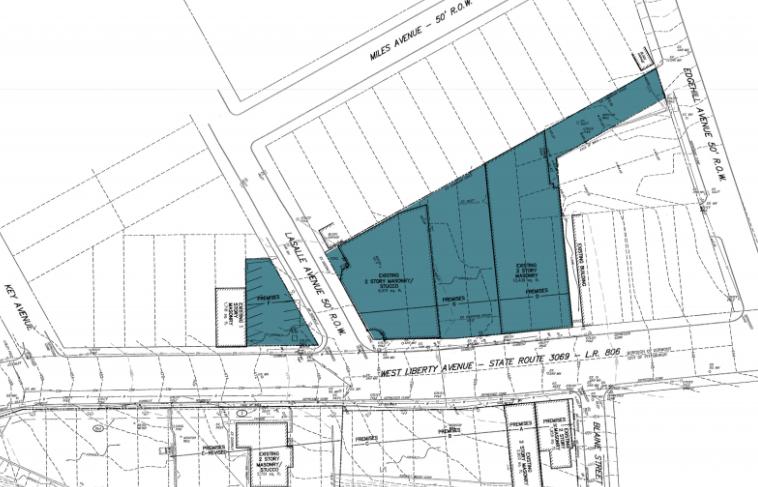
Retail Space
2756 West Liberty Avenue Pittsburgh, PA 15216
2756 West Liberty Avenue Pittsburgh, PA 15216
Details & Description
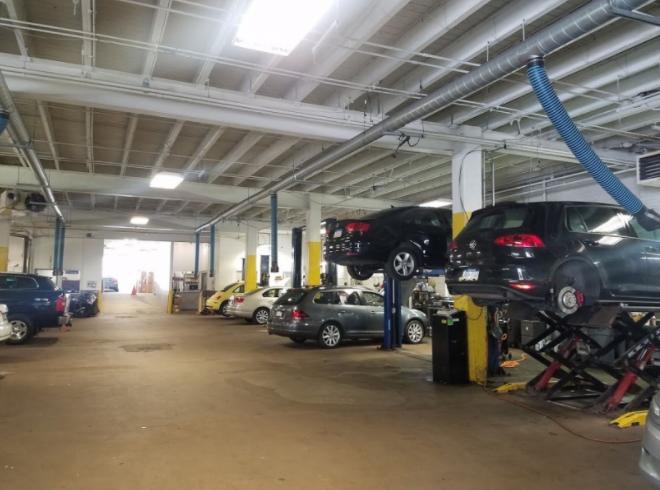
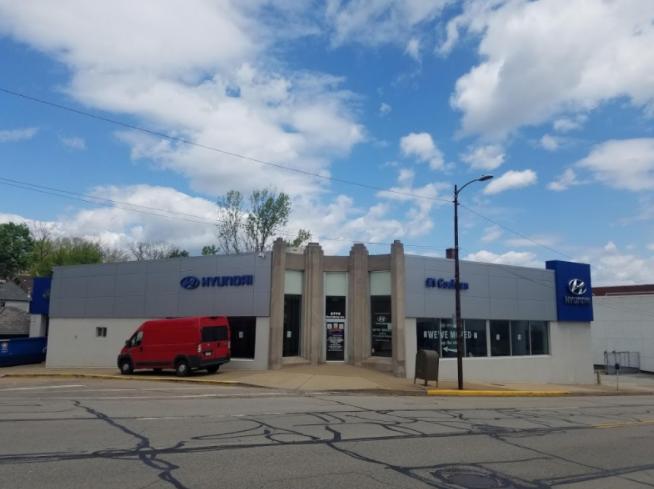
Additional Photos
Listing Agents

Sandra Cikovic
O: 412-261-2200
scikovic@HannaLWE.com
O: 412-261-2200
scikovic@HannaLWE.com

Meagan Moore
O: 412-261-2200
mmoore@HannaLWE.com
O: 412-261-2200
mmoore@HannaLWE.com
While we strive to provide the most accurate information, all listing information, and demographic data, is provided by third-parties. As such, MyEListing will not be responsible for the accuracy of the information. It is strongly recommended that you verify all information with the listing agent, and any relevant agencies, prior to making any decisions.


