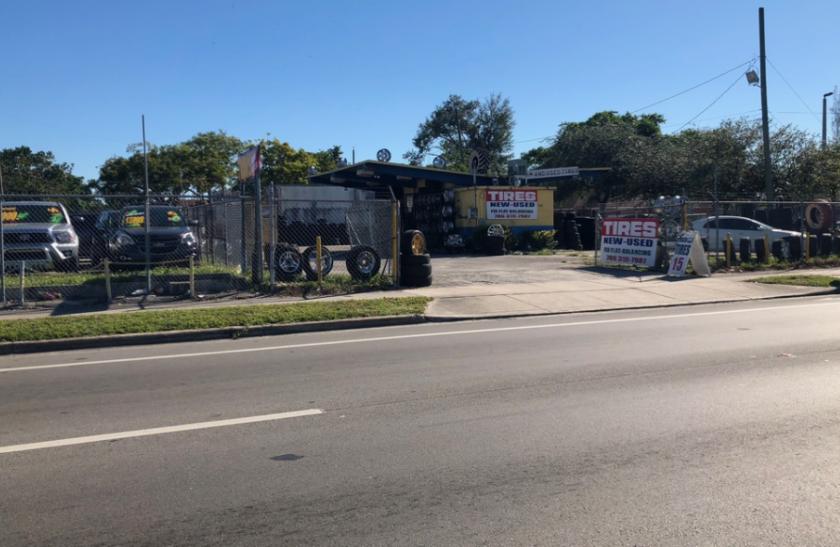
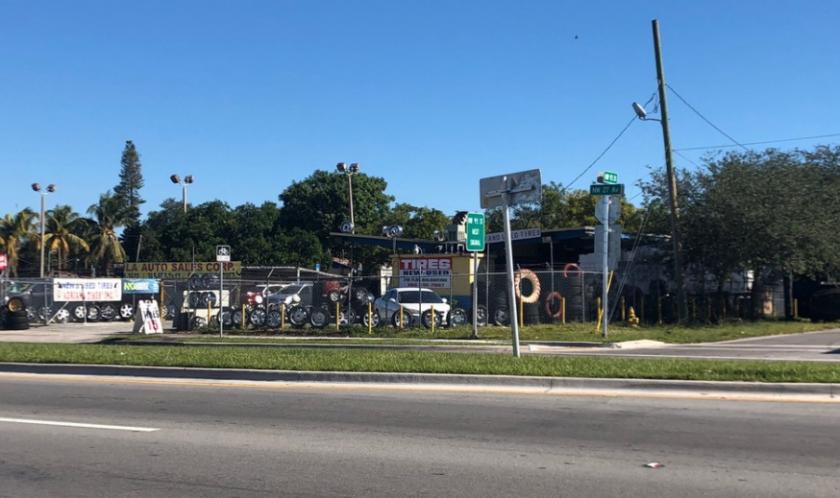
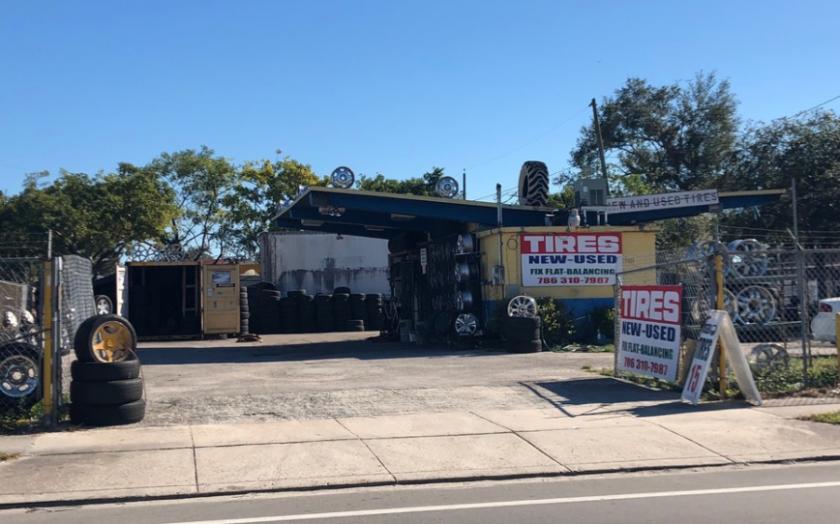
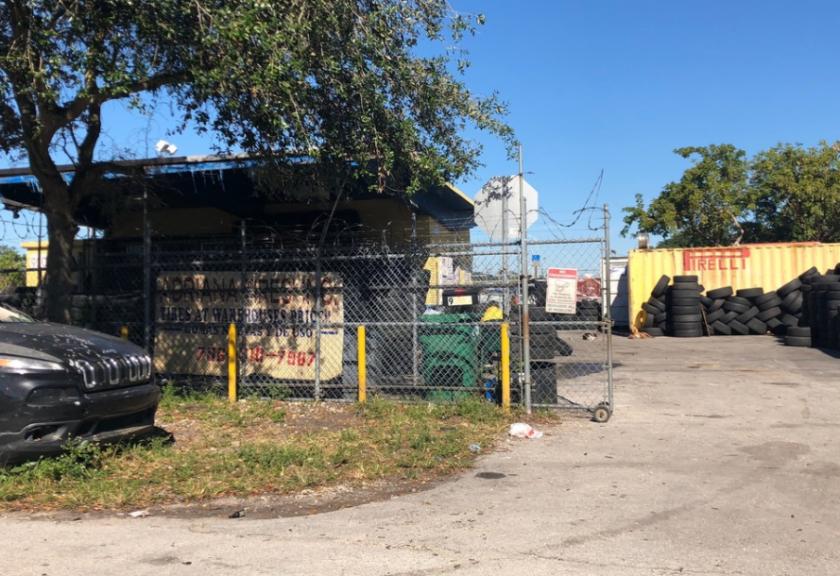
1-Mile | 3-Miles | 5-Miles | ||
---|---|---|---|---|
Total Population | 21,022 | 203,610 | 577,359 | |
Population Median Age | 40 | 39 | 40 | |
Population by Age | 0-9 Yrs | 2487 (11%) | 25642 (12%) | 67896 (11%) |
10-19 Yrs | 2620 (12%) | 25318 (12%) | 65990 (11%) | |
20-29 Yrs | 2740 (13%) | 27289 (13%) | 76788 (13%) | |
30-39 Yrs | 2654 (12%) | 24620 (12%) | 78865 (13%) | |
40-49 Yrs | 2559 (12%) | 26640 (13%) | 79021 (13%) | |
50-59 Yrs | 3283 (15%) | 28338 (13%) | 79591 (13%) | |
60-69 Yrs | 2274 (10%) | 22000 (10%) | 62576 (10%) | |
70+ Yrs | 2405 (11%) | 23762 (11%) | 66632 (11%) | |
Median HH Income | $33,546 | $32,714 | $35,384 | |
Total Household Income | < 24K | 2261 (36%) | 24818 (39%) | 70181 (37%) |
25-49K | 1884 (30%) | 17475 (27%) | 49880 (26%) | |
50-74K | 1171 (18%) | 9815 (15%) | 29868 (15%) | |
75-99K | 439 (7%) | 5296 (8%) | 16116 (8%) | |
100-199K | 420 (6%) | 4802 (7%) | 18383 (9%) | |
200K+ | 36 (0%) | 667 (1%) | 5191 (2%) | |
Highest Education Level | No Diploma | 4392 | 41516 | 111012 |
Diploma or GED | 5997 | 49636 | 131999 | |
Some College | 1963 | 19401 | 58828 | |
Assoc. Degree | 923 | 10928 | 32283 | |
Bachelors Degree | 890 | 12503 | 49631 | |
Higher Degree | 592 | 5217 | 23484 | |
Total Housing Units | 6,746 | 68,516 | 207,079 | |
--Owner-Occupied | 3,622 | 27,772 | 77,603 | |
--Renter-Occupied | 2,589 | 35,101 | 112,014 | |
Owner-Occupied Values | < 100K | 931 | 4103 | 8705 |
100-199K | 1703 | 9573 | 22313 | |
200-299K | 723 | 8537 | 21729 | |
300-399K | 153 | 3556 | 11289 | |
400-499K | 65 | 1110 | 5200 | |
500K+ | 47 | 895 | 8366 | |
Total Working Age Population | 16,786 | 162,616 | 469,761 | |
In Work Force | 9,472 | 93,006 | 278,074 | |
Not In Work Force | 7,315 | 69,610 | 191,687 | |
Workforce Employed | 8,807 | 84,820 | 258,110 | |
Workforce Unemployed | 663 | 8,141 | 19,884 | |
Civlian Workforce | 9,470 | 92,961 | 277,994 | |
Military Workforce | 1 | 45 | 80 | |
Total Households | 6,211 | 62,873 | 189,617 | |
Family Households | 4,355 | 42,544 | 123,973 | |
Non-Family Households | 1,856 | 20,329 | 65,644 | |
Married Couple | 1,993 | 20,141 | 66,087 | |
Other Family | 2,362 | 22,403 | 57,886 | |
Married w/Child | 581 | 7,081 | 23,953 | |
Single Male w/Child | 192 | 1,962 | 4,953 | |
Single Female w/Child | 651 | 7,256 | 20,094 |
Population Change Last Two Decades - Plus Projection
2000 | % | 2010 | % | 2020 | % | 2030 | |
---|---|---|---|---|---|---|---|
Florida | 15,982,378 | +18 | 18,801,310 | +14 | 21,517,610 | +13 | 24,340,457 |
Miami-Dade County | 2,253,362 | +11 | 2,496,435 | +15 | 2,861,579 | +11 | 3,190,242 |
Monroe County | 79,589 | -8 | 73,090 | +1 | 74,004 | 0 | 74,301 |
Total Working Age Population:
Total Households:
Total Working Age Population:
Total Households:
Total Working Age Population:
Total Households: