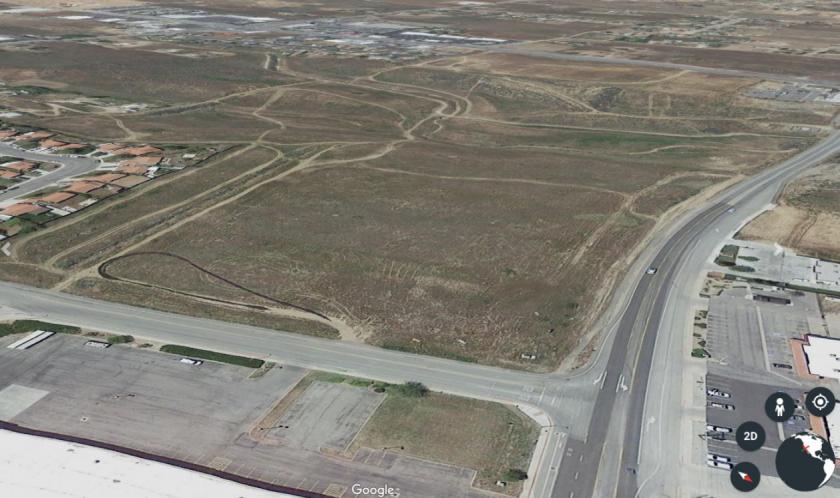
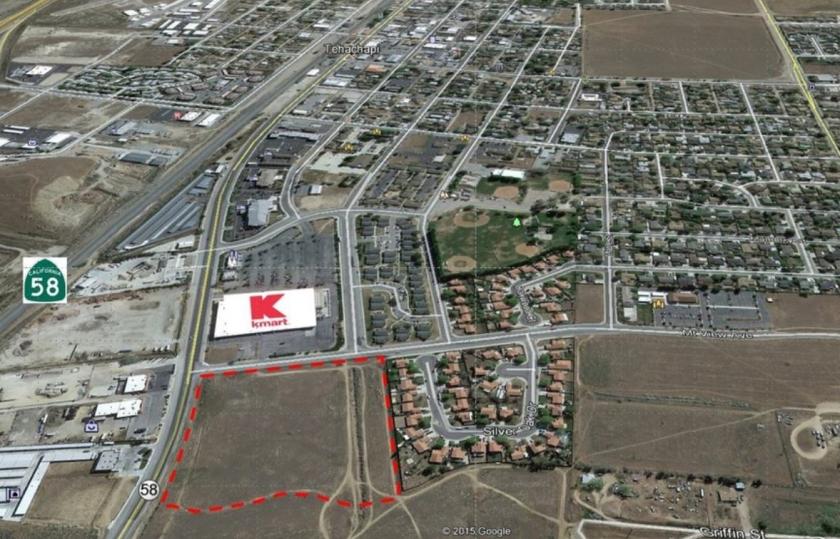
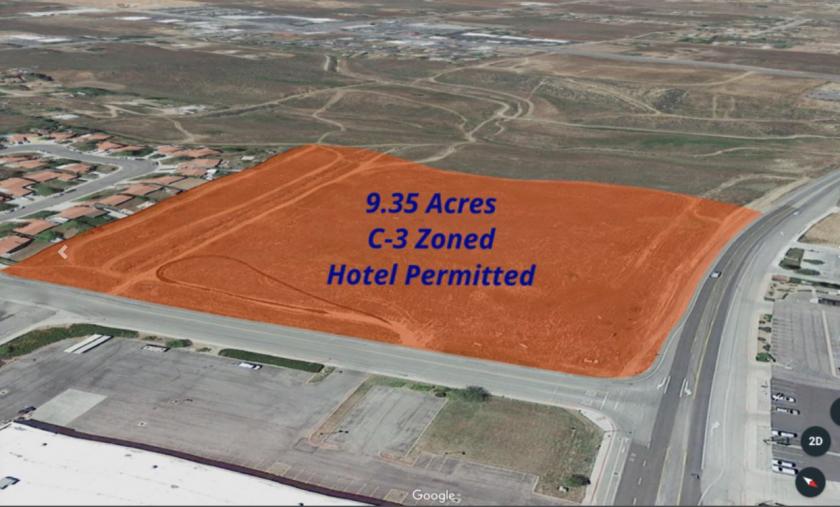
1-Mile | 3-Miles | 5-Miles | ||
---|---|---|---|---|
Total Population | 3,540 | 16,312 | 18,124 | |
Population Median Age | 38 | 37 | 37 | |
Population by Age | 0-9 Yrs | 571 (16%) | 2705 (16%) | 2957 (16%) |
10-19 Yrs | 425 (12%) | 2437 (14%) | 2691 (14%) | |
20-29 Yrs | 228 (6%) | 1461 (8%) | 1572 (8%) | |
30-39 Yrs | 779 (22%) | 2536 (15%) | 2740 (15%) | |
40-49 Yrs | 274 (7%) | 1941 (11%) | 2111 (11%) | |
50-59 Yrs | 479 (13%) | 1986 (12%) | 2323 (12%) | |
60-69 Yrs | 349 (9%) | 1750 (10%) | 1970 (10%) | |
70+ Yrs | 434 (12%) | 1497 (9%) | 1759 (9%) | |
Median HH Income | $50,105 | $60,812 | $62,717 | |
Total Household Income | < 24K | 371 (25%) | 1093 (18%) | 1190 (17%) |
25-49K | 342 (23%) | 1257 (20%) | 1340 (20%) | |
50-74K | 262 (18%) | 1465 (24%) | 1563 (23%) | |
75-99K | 94 (6%) | 568 (9%) | 662 (9%) | |
100-199K | 321 (22%) | 1405 (23%) | 1662 (24%) | |
200K+ | 38 (2%) | 246 (4%) | 278 (4%) | |
Highest Education Level | No Diploma | 360 | 1212 | 1258 |
Diploma or GED | 687 | 2886 | 3167 | |
Some College | 856 | 3168 | 3529 | |
Assoc. Degree | 158 | 1221 | 1446 | |
Bachelors Degree | 160 | 1239 | 1477 | |
Higher Degree | 164 | 723 | 816 | |
Total Housing Units | 1,621 | 6,647 | 7,382 | |
--Owner-Occupied | 811 | 3,794 | 4,345 | |
--Renter-Occupied | 617 | 2,239 | 2,350 | |
Owner-Occupied Values | < 100K | 69 | 293 | 304 |
100-199K | 239 | 1068 | 1131 | |
200-299K | 413 | 1610 | 1788 | |
300-399K | 66 | 650 | 787 | |
400-499K | 0 | 44 | 129 | |
500K+ | 23 | 130 | 207 | |
Total Working Age Population | 2,796 | 12,339 | 13,718 | |
In Work Force | 1,589 | 7,127 | 7,836 | |
Not In Work Force | 1,207 | 5,212 | 5,882 | |
Workforce Employed | 1,460 | 6,687 | 7,373 | |
Workforce Unemployed | 130 | 440 | 464 | |
Civlian Workforce | 1,589 | 7,127 | 7,836 | |
Military Workforce | 0 | 0 | 0 | |
Total Households | 1,427 | 6,033 | 6,695 | |
Family Households | 893 | 4,092 | 4,575 | |
Non-Family Households | 535 | 1,941 | 2,120 | |
Married Couple | 621 | 2,897 | 3,317 | |
Other Family | 271 | 1,195 | 1,258 | |
Married w/Child | 355 | 1,426 | 1,560 | |
Single Male w/Child | 12 | 152 | 161 | |
Single Female w/Child | 101 | 351 | 356 |
Population Change Last Two Decades - Plus Projection
2000 | % | 2010 | % | 2020 | % | 2030 | |
---|---|---|---|---|---|---|---|
California | 33,871,648 | +10 | 37,253,956 | +9 | 40,467,295 | +8 | 43,631,295 |
Kern County | 661,645 | +27 | 839,631 | +11 | 928,308 | +14 | 1,062,325 |
Total Working Age Population:
Total Households:
Total Working Age Population:
Total Households:
Total Working Age Population:
Total Households: