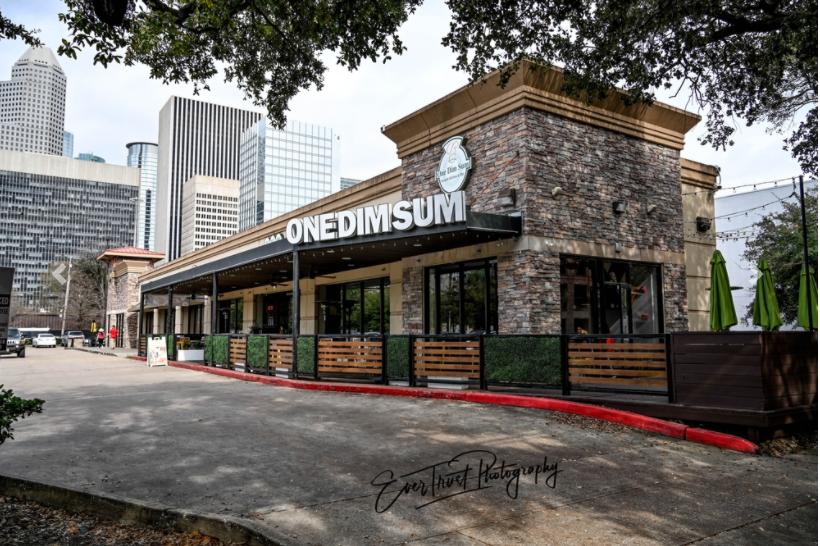
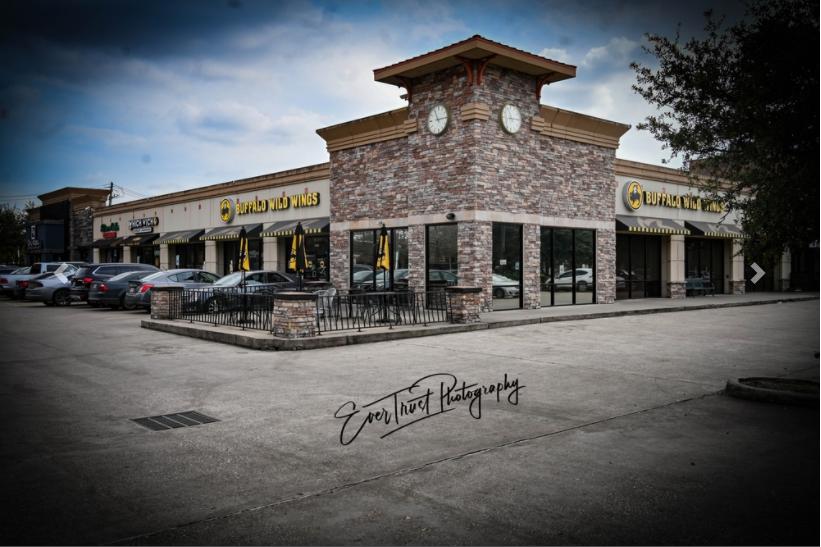
1-Mile | 3-Miles | 5-Miles | ||
---|---|---|---|---|
Total Population | 23,397 | 181,730 | 426,874 | |
Population Median Age | 36 | 37 | 37 | |
Population by Age | 0-9 Yrs | 1180 (5%) | 13994 (7%) | 44504 (10%) |
10-19 Yrs | 875 (3%) | 14233 (7%) | 38604 (9%) | |
20-29 Yrs | 7943 (33%) | 46117 (25%) | 92381 (21%) | |
30-39 Yrs | 5695 (24%) | 37676 (20%) | 81238 (19%) | |
40-49 Yrs | 2962 (12%) | 23169 (12%) | 53604 (12%) | |
50-59 Yrs | 2258 (9%) | 19166 (10%) | 47488 (11%) | |
60-69 Yrs | 1562 (6%) | 17320 (9%) | 40461 (9%) | |
70+ Yrs | 921 (3%) | 10056 (5%) | 28594 (6%) | |
Median HH Income | $84,103 | $83,287 | $71,942 | |
Total Household Income | < 24K | 2332 (16%) | 14618 (17%) | 37639 (20%) |
25-49K | 1490 (10%) | 11607 (13%) | 30932 (16%) | |
50-74K | 2376 (17%) | 12306 (14%) | 26950 (14%) | |
75-99K | 1875 (13%) | 8941 (10%) | 18884 (10%) | |
100-199K | 3598 (26%) | 20143 (24%) | 39453 (21%) | |
200K+ | 2091 (15%) | 15377 (18%) | 31329 (16%) | |
Highest Education Level | No Diploma | 663 | 12727 | 40637 |
Diploma or GED | 1324 | 16691 | 45709 | |
Some College | 2583 | 18108 | 41608 | |
Assoc. Degree | 779 | 5935 | 13725 | |
Bachelors Degree | 7203 | 43183 | 86446 | |
Higher Degree | 5832 | 37336 | 76999 | |
Total Housing Units | 16,022 | 96,231 | 213,857 | |
--Owner-Occupied | 4,054 | 33,377 | 80,183 | |
--Renter-Occupied | 9,707 | 49,615 | 105,003 | |
Owner-Occupied Values | < 100K | 145 | 1750 | 11627 |
100-199K | 467 | 3856 | 11675 | |
200-299K | 740 | 4959 | 9598 | |
300-399K | 1011 | 6203 | 11473 | |
400-499K | 706 | 4984 | 9385 | |
500K+ | 986 | 11623 | 26425 | |
Total Working Age Population | 21,706 | 161,454 | 361,458 | |
In Work Force | 17,809 | 111,774 | 244,900 | |
Not In Work Force | 3,897 | 49,680 | 116,558 | |
Workforce Employed | 17,151 | 107,015 | 233,789 | |
Workforce Unemployed | 658 | 4,711 | 10,952 | |
Civlian Workforce | 17,809 | 111,726 | 244,741 | |
Military Workforce | 0 | 48 | 158 | |
Total Households | 13,761 | 82,992 | 185,186 | |
Family Households | 3,656 | 32,899 | 87,902 | |
Non-Family Households | 10,105 | 50,093 | 97,285 | |
Married Couple | 2,541 | 24,145 | 63,119 | |
Other Family | 1,115 | 8,753 | 24,782 | |
Married w/Child | 442 | 7,081 | 22,623 | |
Single Male w/Child | 123 | 777 | 2,235 | |
Single Female w/Child | 492 | 3,171 | 9,084 |
Population Change Last Two Decades - Plus Projection
2000 | % | 2010 | % | 2020 | % | 2030 | |
---|---|---|---|---|---|---|---|
Texas | 20,851,820 | +21 | 25,145,561 | +18 | 29,677,668 | +18 | 34,894,452 |
Fort Bend County | 354,452 | +65 | 585,375 | +44 | 840,383 | +43 | 1,203,029 |
Harris County | 3,400,578 | +20 | 4,092,459 | +22 | 4,978,845 | +19 | 5,924,750 |
Total Working Age Population:
Total Households:
Total Working Age Population:
Total Households:
Total Working Age Population:
Total Households: