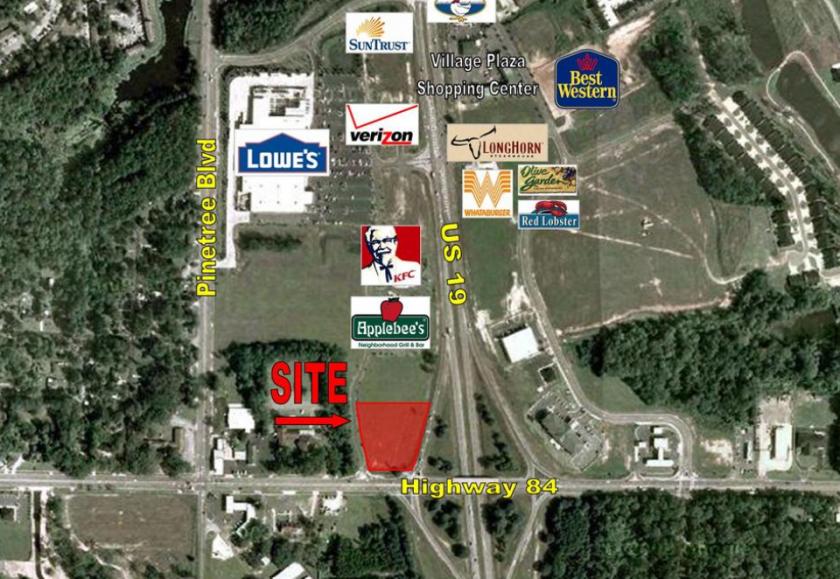
1-Mile | 3-Miles | 5-Miles | ||
---|---|---|---|---|
Total Population | 1,263 | 13,494 | 26,532 | |
Population Median Age | 43 | 39 | 38 | |
Population by Age | 0-9 Yrs | 110 (8%) | 1678 (12%) | 3619 (13%) |
10-19 Yrs | 156 (12%) | 1798 (13%) | 3590 (13%) | |
20-29 Yrs | 79 (6%) | 1952 (14%) | 3499 (13%) | |
30-39 Yrs | 191 (15%) | 1772 (13%) | 3383 (12%) | |
40-49 Yrs | 150 (11%) | 1491 (11%) | 3129 (11%) | |
50-59 Yrs | 204 (16%) | 1516 (11%) | 3210 (12%) | |
60-69 Yrs | 271 (21%) | 1983 (14%) | 3356 (12%) | |
70+ Yrs | 101 (7%) | 1305 (9%) | 2747 (10%) | |
Median HH Income | $35,775 | $36,809 | $39,131 | |
Total Household Income | < 24K | 187 (28%) | 1560 (27%) | 3094 (29%) |
25-49K | 190 (29%) | 1761 (31%) | 3015 (28%) | |
50-74K | 50 (7%) | 762 (13%) | 1522 (14%) | |
75-99K | 96 (14%) | 555 (9%) | 1018 (9%) | |
100-199K | 116 (17%) | 970 (17%) | 1725 (16%) | |
200K+ | 9 (1%) | 70 (1%) | 229 (2%) | |
Highest Education Level | No Diploma | 153 | 1105 | 2521 |
Diploma or GED | 322 | 2712 | 5423 | |
Some College | 138 | 1790 | 3595 | |
Assoc. Degree | 58 | 830 | 1442 | |
Bachelors Degree | 188 | 1579 | 2650 | |
Higher Degree | 105 | 1192 | 2067 | |
Total Housing Units | 739 | 6,675 | 12,483 | |
--Owner-Occupied | 298 | 2,808 | 5,511 | |
--Renter-Occupied | 351 | 2,869 | 5,093 | |
Owner-Occupied Values | < 100K | 100 | 641 | 1665 |
100-199K | 140 | 1330 | 2259 | |
200-299K | 36 | 549 | 860 | |
300-399K | 2 | 174 | 385 | |
400-499K | 10 | 50 | 90 | |
500K+ | 11 | 65 | 253 | |
Total Working Age Population | 1,021 | 10,539 | 20,506 | |
In Work Force | 703 | 6,589 | 12,427 | |
Not In Work Force | 318 | 3,950 | 8,079 | |
Workforce Employed | 674 | 6,198 | 11,497 | |
Workforce Unemployed | 29 | 334 | 866 | |
Civlian Workforce | 703 | 6,533 | 12,363 | |
Military Workforce | 0 | 56 | 64 | |
Total Households | 649 | 5,678 | 10,603 | |
Family Households | 280 | 3,703 | 7,242 | |
Non-Family Households | 368 | 1,974 | 3,362 | |
Married Couple | 205 | 2,222 | 4,246 | |
Other Family | 75 | 1,481 | 2,996 | |
Married w/Child | 35 | 630 | 1,270 | |
Single Male w/Child | 1 | 213 | 397 | |
Single Female w/Child | 64 | 712 | 1,291 |
Population Change Last Two Decades - Plus Projection
2000 | % | 2010 | % | 2020 | % | 2030 | |
---|---|---|---|---|---|---|---|
Georgia | 8,186,453 | +18 | 9,687,653 | +12 | 10,833,472 | +13 | 12,292,423 |
Thomas County | 42,737 | +5 | 44,720 | -1 | 44,431 | 0 | 44,532 |
Total Working Age Population:
Total Households:
Total Working Age Population:
Total Households:
Total Working Age Population:
Total Households: