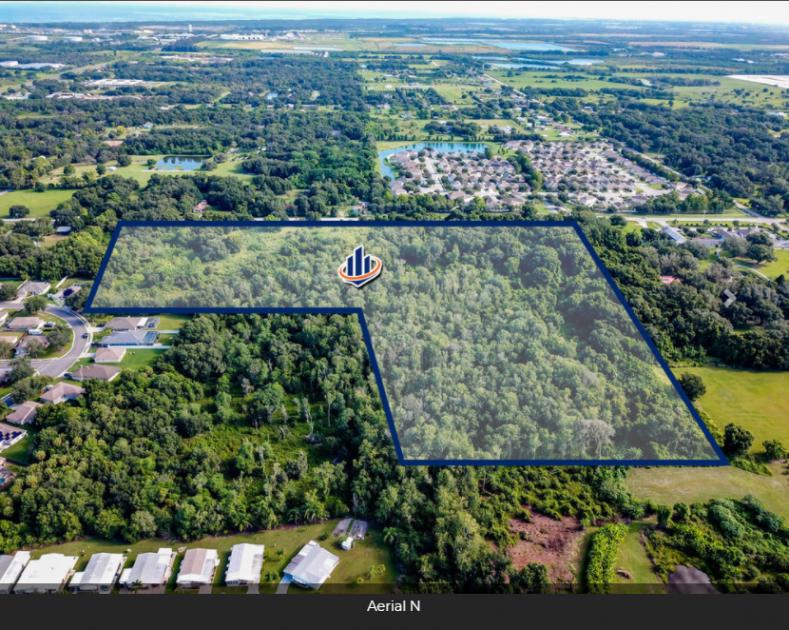
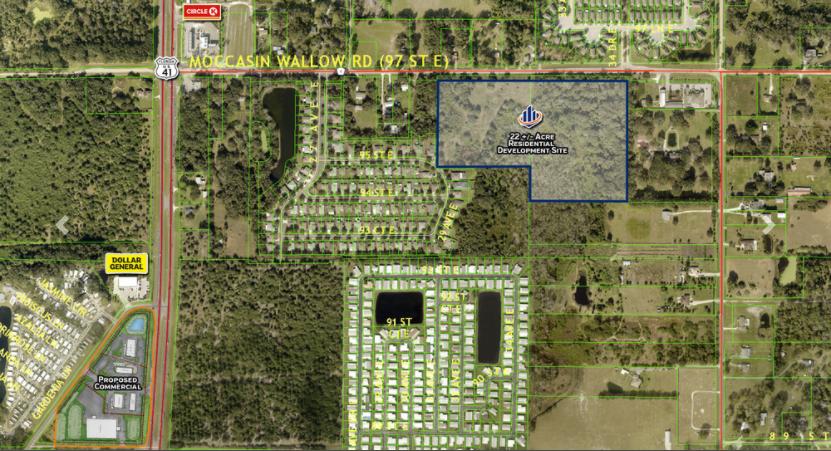
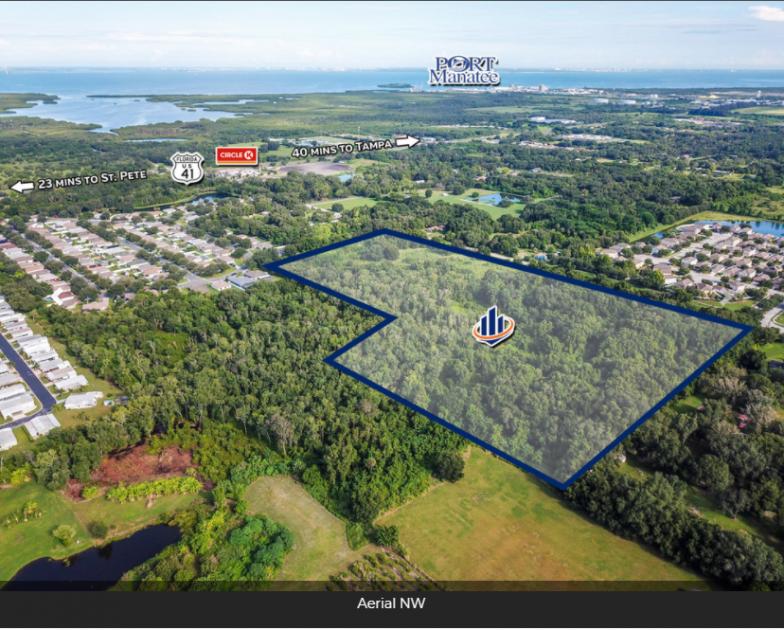
This residential development site, located in rapidly-growing northern Manatee County is on Moccasin Wallow Road between US-41 to the west and Interstate 75 to the east. Its central location makes it a short drive to downtown St. Petersburg and Tampa to the north and Bradenton, Lakewood Ranch and Sarasota to the south.
The 22+/- acre site is ideal for an apartment project, single family subdivision or a build-for-rent community. It's possible that the site could be rezoned for up to 159 units with a rezone to Planned Development-Residential. This is one of the fastest growing areas of Manatee County with over 23,000 residential units approved or under construction. The site is in close proximity to a Circle K and 7-Eleven convenience store, Dollar General, a new Publix shopping center, a brewery and other restaurants.
Highlights
22+/- acre residential development site; ideal for multifamily, single family or build-for-rent community
Two separate parcels - Can also be purchased as 9+/- acres or 13+/- acres
Potential to rezone to Planned Development-Residential. Future Land Use may allow for max of 159 units
Centrally located with a short drive to St. Pete, Tampa, Bradenton, Lakewood Ranch and Sarasota
Large North River employers include Port Manatee, The Ellenton Premium Outlets, Feld Entertainment, Sysco and ItWorks!
No part of this information may be copied, reproduced, repurposed, or screen-captured for any commercial purpose without prior written authorization from MyEListing.
While we strive to provide the most accurate information, all listing information, and demographic data, is provided by third-parties. As such, MyEListing will not be responsible for the accuracy of the information. It is strongly recommended that you verify all information with the listing agent, and any relevant agencies, prior to making any decisions.
What is the asking price for 3005 Moccasin Wallow Road in Palmetto?
The asking price for 3005 Moccasin Wallow Road is $2,280,000
How much land does the Palmetto, FL property at 3005 Moccasin Wallow Road include?
3005 Moccasin Wallow Road in Palmetto includes 22.000 acres of land
What kind of Land is the propery at 3005 Moccasin Wallow Road?
The property at 3005 Moccasin Wallow Road Palmetto, FL 34221 is listed as a Apartment Land Land property
What is the population within 1 mile of 3005 Moccasin Wallow Road in Palmetto?
The population within 1 mile of 3005 Moccasin Wallow Road Palmetto, FL 34221 is 2,360 people.
Who do I contact for questions about 3005 Moccasin Wallow Road?
You should contact the listing agent,
Matt Fenske, for any details regarding this commercial listing.