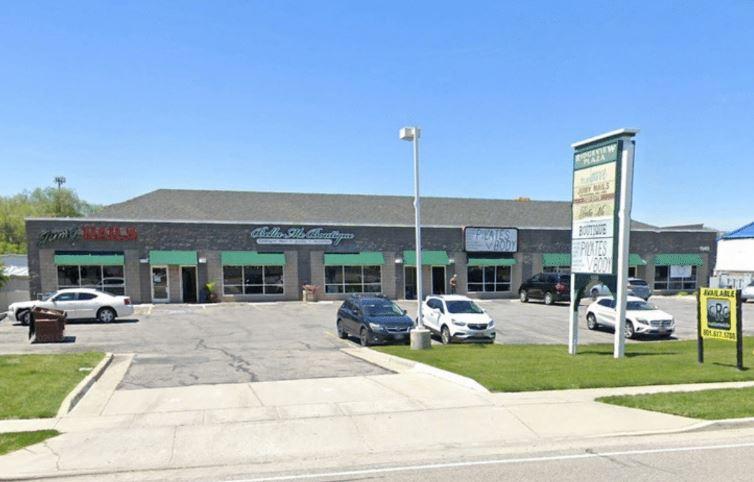
- Unit 5: 1,200 SF Storefront Retail
- Excellent Visibility from Washington Blvd.
- Large Pylon Sign
- Year Built: 2000
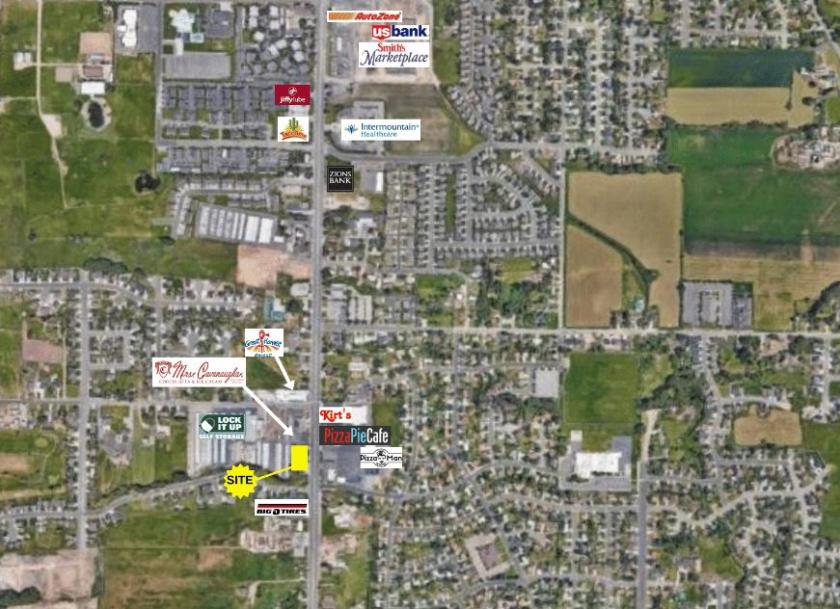
- Heavy Traffic Area
- Co-Tenants Include: Bella Me Boutique, Jumy Nails and Pilates Body
- Nearby Tenants Include: Pizza Pie Cafe, Big O Tires, Great Harvest Bread Co., Kirt's, Mrs. Cavanaugh's
LEASE RATE: $13.00/SF NNN
1949 N. Washington Blvd., North Ogden, Utah 84414
For more information on this property, please contact Sam Christensen at 801.361.9798 or by email at sam.christensen@crcnationwide.com. Sam is a licensed real estate agent in the State of Utah and is affiliated with cRc nationwide Real Estate Brokerage.
No part of this information may be copied, reproduced, repurposed, or screen-captured for any commercial purpose without prior written authorization from MyEListing.
While we strive to provide the most accurate information, all listing information, and demographic data, is provided by third-parties. As such, MyEListing will not be responsible for the accuracy of the information. It is strongly recommended that you verify all information with the listing agent, and any relevant agencies, prior to making any decisions.
What is the asking price for 1949 North Washington Boulevard in North Ogden?
The asking price for 1949 North Washington Boulevard is $
What is the building size of this commercial Retail property?
The size of this lease property at '.1949 North Washington Boulevard.' is 1200 square feet
What kind of Retail is the propery at 1949 North Washington Boulevard?
The property at 1949 North Washington Boulevard North Ogden, UT 84414 is listed as a Shopping Center Retail property
What is the population within 1 mile of 1949 North Washington Boulevard in North Ogden?
The population within 1 mile of 1949 North Washington Boulevard North Ogden, UT 84414 is 9,763 people.
Who do I contact for questions about 1949 North Washington Boulevard?
You should contact the listing agent,
Sam Christensen, for any details regarding this commercial listing.