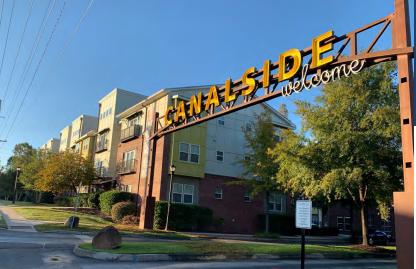
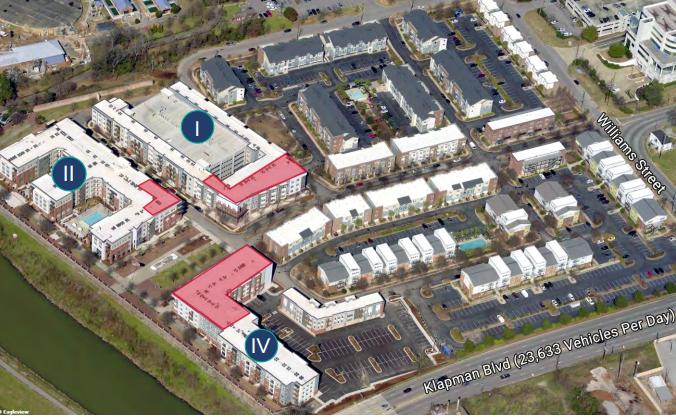
The newest addition to the award-winning Canalside Community, Sola Station is Columbia’s first riverfront destination and neighborhood. Sola Station’s retail, office, dining, premier residences, and amenities offer unmatched views of the Congaree River, as well as access to the esplanade and greenway. Located along the Three Rivers Greenway, a 9.5-mile riverfront park, this is where vibrant city life collides with outdoor adventure.RETAIL & DININGRetail and Dining Storefronts are available on the river esplanade. These retail spaces service over 1,000 residents of Sola Station and Lofts at Canalside, as well as thousands of Midlands residents visiting Riverfront Park, the State Museum, and Edventure. A unique opportunity exists for riverfront dining with picturesque views.OFFICELocated just minutes from the center of the Central Business District, Sola Station offers an exciting opportunity to work on the river without losing access to Columbia’s best employers, attractions, and amenities. Sola Station offers employees an inspiring interactive lifestyle domain with dining, shopping, riverfront walking, and trails.LEISURELocated along the Three Rivers Greenway, a 9.5 mile, riverfront park near the area where the Broad and Saluda Rivers converge to form the Congaree River, the area offers lighted walking and biking trails, timber boardwalks, and outdoor amphitheaters.