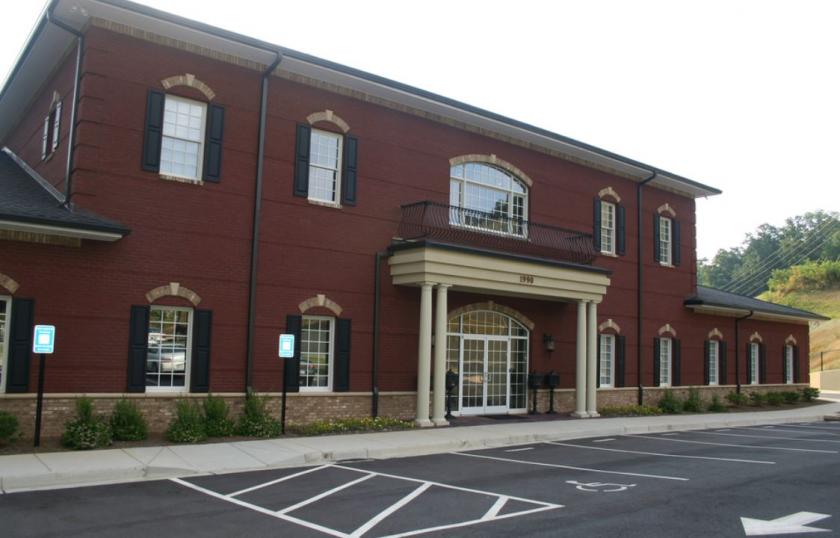
Office Space
1990 Limestone Circle Gainesville, GA 30501
1990 Limestone Circle Gainesville, GA 30501
Details & Description
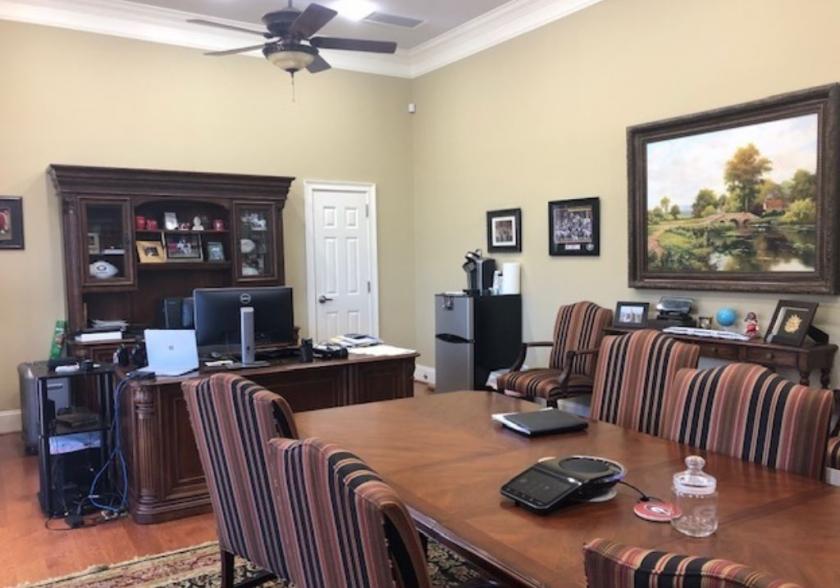
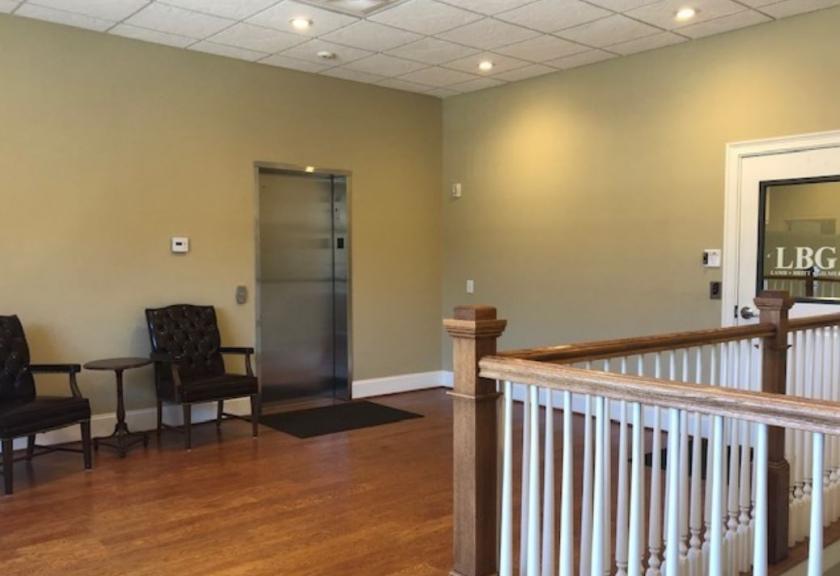
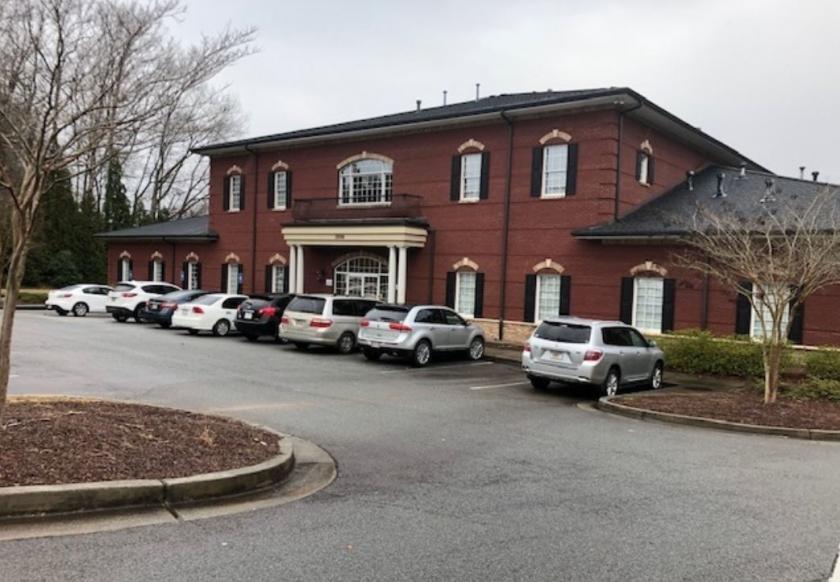
Additional Photos
Listing Agents

Karen Baston
O: 770-531-9992
M: 770-861-8006
karen.baston@svn.com
O: 770-531-9992
M: 770-861-8006
karen.baston@svn.com
While we strive to provide the most accurate information, all listing information, and demographic data, is provided by third-parties. As such, MyEListing will not be responsible for the accuracy of the information. It is strongly recommended that you verify all information with the listing agent, and any relevant agencies, prior to making any decisions.


