We protect the American people and uphold the U.S. Constitution.
You can report suspicious activities and crime by contacting us 24/7 at tips.fbi.gov.
I Want To


Featured Content
A Legacy in Law Enforcement: A Mother’s and Son's Journeys to the FBI

FBI Special Agent Kevin Vázquez has been part of the FBI extended family since his mom, Supervisory Special Agent Marilyn Santos, joined the Bureau when he was a kid.
Protected Voices

The FBI’s Protected Voices initiative provides tools and resources to political campaigns, companies, and individuals to protect against online foreign influence operations, cyber threats, and federal election crimes.

Capitol Violence
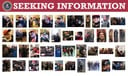
The FBI is seeking to identify individuals involved in the violent activities that occurred at the U.S. Capitol and surrounding areas on January 6, 2021. View photos and related information here. If you have any information to provide, visit tips.fbi.gov or call 1-800-CALL-FBI.
News
Stories
-
05.10.2024
A Legacy in Law Enforcement: A Mother’s and Son's Journeys to the FBI
FBI Special Agent Kevin Vázquez has been part of the FBI extended family since his mom, Supervisory Special Agent Marilyn Santos, joined the Bureau when he was a kid.
-
05.03.2024
Hopi Special Agent Returns Home to Seek Justice for Tribal Communities
For FBI Special Agent Piere Himel–an enrolled member of the Hopi Tribe—investigating Indian Country Crime on reservations in New Mexico is more than just a job: it’s a homecoming.
-
04.30.2024
Elder fraud complaints to the FBI’s Internet Crime Complaint Center (or IC3) increased by 14% in 2023, and associated losses increased by about 11%, according to IC3’s 2023 Elder Fraud Report, released April 30. This annual publication provides statistics about incidents of elder fraud—or fraud that explicitly targets older Americans’ money or cryptocurrency—that are reported to IC3.
-
04.29.2024
Charlotte Child Pornography Case Shows 'Unsettling' Reach of AI Imagery
Child psychiatrist David Tatum was sentenced to 40 years in prison for using generative artificial intelligence to digitally alter clothed images of minors into child pornography.
Podcasts
-
04.26.2024
Inside the FBI Podcast: Trauma Notification Training
On this episode of Inside the FBI, we’ll hear from Victim Services Coordinator Dr. Staci Beers about the FBI's new Trauma Notification Training.
-
04.18.2024
Inside the FBI Podcast: Investigating Torture
On this episode of Inside the FBI, we’ll share the story behind a joint investigation by the FBI and Homeland Security Investigations that helped secure the second-ever conviction under the United States’ federal torture statute since its implementation in 1994.
-
03.29.2024
Inside the FBI Podcast: What Happened to Karla Rodriguez?
On this episode of Inside the FBI, learn how the Bureau and our law enforcement partners are working to find Karla Carolina Rodriguez, who disappeared in Las Vegas in October 1999.
-
02.29.2024
Inside the FBI Podcast: The Phantom Hacker Scam
On this episode of Inside the FBI, learn about the Phantom Hacker scam—a type of tech support scam that's growing in popularity—and how to avoid becoming its next victim.
Press Releases
-
05.09.2024
-
05.08.2024
Ohio Man Convicted of Assaulting Law Enforcement and Other Charges During January 6 Capitol Breach
-
05.08.2024
-
05.08.2024
Defense Contractor Pleads Guilty to Fraud, Money Laundering and Unlawful Export of Military Data
-
05.08.2024
-
05.07.2024
Man Convicted in Cold Case Murder on Military Base in Germany
-
05.06.2024
Georgia Man Arrested on Felony and Misdemeanor Charges for Actions During January 6 Capitol Breach
-
05.03.2024
Ohio Man Arrested on Felony and Misdemeanor Charges for Actions During January 6 Capitol Breach