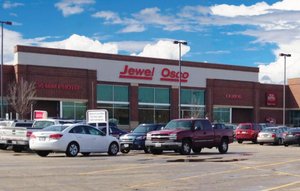
1-Mile | 3-Miles | 5-Miles | ||
---|---|---|---|---|
Total Population | 5,977 | 117,177 | 251,076 | |
Population Median Age | 43 | 38 | 38 | |
Population by Age | 0-9 Yrs | 503 (8%) | 14263 (12%) | 31639 (12%) |
10-19 Yrs | 905 (15%) | 17711 (15%) | 38084 (15%) | |
20-29 Yrs | 668 (11%) | 16129 (13%) | 35082 (13%) | |
30-39 Yrs | 530 (8%) | 13157 (11%) | 29692 (11%) | |
40-49 Yrs | 907 (15%) | 15649 (13%) | 31245 (12%) | |
50-59 Yrs | 658 (11%) | 15545 (13%) | 34144 (13%) | |
60-69 Yrs | 876 (14%) | 13448 (11%) | 27665 (11%) | |
70+ Yrs | 930 (15%) | 11276 (9%) | 23525 (9%) | |
Median HH Income | $39,214 | $50,756 | $48,920 | |
Total Household Income | < 24K | 807 (31%) | 10812 (24%) | 23986 (26%) |
25-49K | 673 (25%) | 10584 (24%) | 22898 (24%) | |
50-74K | 374 (14%) | 8549 (19%) | 17119 (18%) | |
75-99K | 311 (11%) | 5382 (12%) | 10835 (11%) | |
100-199K | 401 (15%) | 7198 (16%) | 15232 (16%) | |
200K+ | 30 (1%) | 860 (1%) | 2107 (2%) | |
Highest Education Level | No Diploma | 621 | 9366 | 22004 |
Diploma or GED | 1207 | 23017 | 50630 | |
Some College | 1142 | 21509 | 43180 | |
Assoc. Degree | 203 | 6735 | 13813 | |
Bachelors Degree | 655 | 10617 | 21942 | |
Higher Degree | 373 | 5803 | 11379 | |
Total Housing Units | 2,980 | 49,206 | 105,487 | |
--Owner-Occupied | 1,741 | 27,492 | 58,346 | |
--Renter-Occupied | 855 | 15,893 | 33,831 | |
Owner-Occupied Values | < 100K | 935 | 10208 | 23672 |
100-199K | 447 | 14165 | 26325 | |
200-299K | 243 | 2127 | 5552 | |
300-399K | 89 | 629 | 1577 | |
400-499K | 2 | 86 | 534 | |
500K+ | 24 | 277 | 686 | |
Total Working Age Population | 5,051 | 92,188 | 196,913 | |
In Work Force | 3,050 | 58,664 | 123,182 | |
Not In Work Force | 2,000 | 33,525 | 73,731 | |
Workforce Employed | 2,526 | 51,244 | 108,458 | |
Workforce Unemployed | 509 | 7,343 | 14,609 | |
Civlian Workforce | 3,035 | 58,587 | 123,067 | |
Military Workforce | 15 | 76 | 115 | |
Total Households | 2,596 | 43,385 | 92,177 | |
Family Households | 1,300 | 27,660 | 59,851 | |
Non-Family Households | 1,297 | 15,725 | 32,326 | |
Married Couple | 682 | 14,157 | 31,856 | |
Other Family | 618 | 13,504 | 27,995 | |
Married w/Child | 179 | 5,127 | 11,475 | |
Single Male w/Child | 41 | 1,225 | 2,380 | |
Single Female w/Child | 223 | 5,491 | 11,517 |
Population Change Last Two Decades - Plus Projection
2000 | % | 2010 | % | 2020 | % | 2030 | |
---|---|---|---|---|---|---|---|
Illinois | 12,419,293 | +3 | 12,830,632 | +12 | 14,316,487 | +6 | 15,138,849 |
Cook County | 5,376,741 | -3 | 5,194,675 | +10 | 5,707,832 | +5 | 5,990,243 |
Will County | 502,266 | +35 | 677,560 | +34 | 907,625 | +20 | 1,093,207 |
Indiana | 6,080,485 | +7 | 6,483,802 | +4 | 6,738,573 | +4 | 7,014,880 |
Lake County | 484,564 | +2 | 496,005 | -3 | 479,815 | +1 | 482,321 |
Total Working Age Population:
Total Households:
Total Working Age Population:
Total Households:
Total Working Age Population:
Total Households: