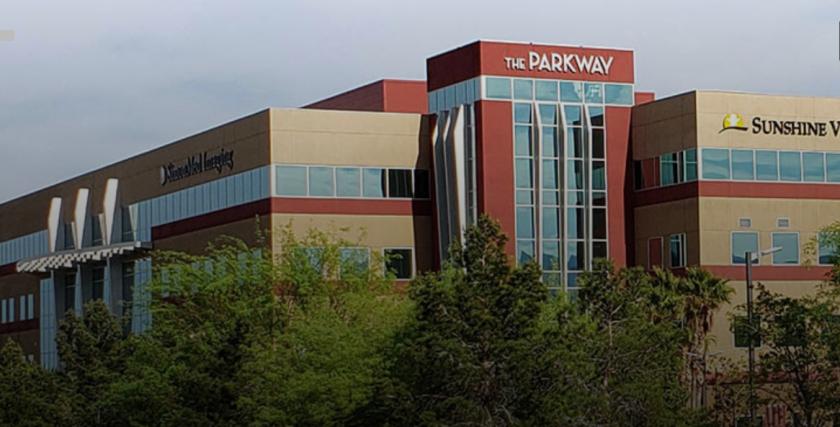
1-Mile | 3-Miles | 5-Miles | ||
---|---|---|---|---|
Total Population | 24,115 | 172,397 | 465,040 | |
Population Median Age | 40 | 40 | 40 | |
Population by Age | 0-9 Yrs | 2246 (9%) | 19623 (11%) | 54001 (11%) |
10-19 Yrs | 2956 (12%) | 19864 (11%) | 55532 (11%) | |
20-29 Yrs | 3978 (16%) | 24882 (14%) | 61106 (13%) | |
30-39 Yrs | 2949 (12%) | 22381 (12%) | 60173 (12%) | |
40-49 Yrs | 3543 (14%) | 22661 (13%) | 63244 (13%) | |
50-59 Yrs | 3356 (13%) | 23747 (13%) | 61666 (13%) | |
60-69 Yrs | 2434 (10%) | 20197 (11%) | 55049 (11%) | |
70+ Yrs | 2653 (11%) | 19042 (11%) | 54270 (11%) | |
Median HH Income | $45,291 | $51,076 | $56,152 | |
Total Household Income | < 24K | 1952 (20%) | 14837 (22%) | 35046 (19%) |
25-49K | 3233 (33%) | 17979 (26%) | 44125 (25%) | |
50-74K | 1979 (20%) | 12371 (18%) | 32875 (18%) | |
75-99K | 1113 (11%) | 8511 (12%) | 23887 (13%) | |
100-199K | 1173 (12%) | 10062 (15%) | 30636 (17%) | |
200K+ | 160 (1%) | 3063 (4%) | 9037 (5%) | |
Highest Education Level | No Diploma | 2165 | 17311 | 45735 |
Diploma or GED | 5360 | 36144 | 94486 | |
Some College | 4779 | 30171 | 80213 | |
Assoc. Degree | 1359 | 9543 | 25622 | |
Bachelors Degree | 2361 | 17984 | 53602 | |
Higher Degree | 1073 | 10406 | 28213 | |
Total Housing Units | 11,195 | 75,637 | 196,105 | |
--Owner-Occupied | 4,754 | 32,541 | 90,746 | |
--Renter-Occupied | 4,856 | 34,283 | 84,860 | |
Owner-Occupied Values | < 100K | 547 | 2760 | 5961 |
100-199K | 2028 | 10024 | 22519 | |
200-299K | 1910 | 9830 | 29068 | |
300-399K | 199 | 4291 | 17430 | |
400-499K | 57 | 1758 | 6339 | |
500K+ | 13 | 3878 | 9429 | |
Total Working Age Population | 20,045 | 140,551 | 376,250 | |
In Work Force | 13,451 | 88,527 | 237,073 | |
Not In Work Force | 6,594 | 52,024 | 139,177 | |
Workforce Employed | 12,626 | 82,685 | 221,372 | |
Workforce Unemployed | 770 | 5,625 | 15,278 | |
Civlian Workforce | 13,396 | 88,310 | 236,650 | |
Military Workforce | 55 | 217 | 423 | |
Total Households | 9,610 | 66,824 | 175,606 | |
Family Households | 5,301 | 38,990 | 107,273 | |
Non-Family Households | 4,309 | 27,834 | 68,333 | |
Married Couple | 3,496 | 25,215 | 70,938 | |
Other Family | 1,805 | 13,774 | 36,335 | |
Married w/Child | 1,206 | 8,727 | 25,236 | |
Single Male w/Child | 212 | 1,603 | 4,899 | |
Single Female w/Child | 555 | 4,791 | 12,215 |
Population Change Last Two Decades - Plus Projection
2000 | % | 2010 | % | 2020 | % | 2030 | |
---|---|---|---|---|---|---|---|
Nevada | 1,998,257 | +35 | 2,700,551 | +17 | 3,149,234 | +10 | 3,460,728 |
Clark County | 1,375,765 | +42 | 1,951,269 | +19 | 2,318,174 | +10 | 2,550,048 |
Nye County | 32,485 | +35 | 43,946 | +11 | 48,864 | +8 | 52,587 |
Total Working Age Population:
Total Households:
Total Working Age Population:
Total Households:
Total Working Age Population:
Total Households: