Highlights
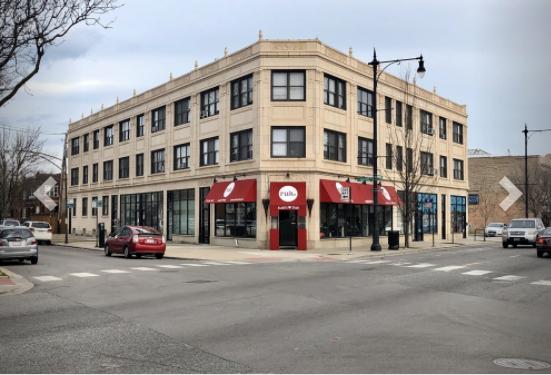
100% Occupied, 23 Unit Property 17 Apts and 6 Storefronts
Walking Distance to 2 CTA train stops and Metra. 2 Blocks from I-90/94 Highway.
Clean, large, spacious units with ability to add extra bedrooms.
New boilers, plumbing, electric (2018). Newer windows, porches, windows and tuck pointing!
Below market rents allow for additional upside!
Friendly Alderman.
Adjacent 100 x 125 lot is also available for sale.
Booming diagonal corridor!
Very high traffic counts exceeding 14,800 along Milwaukee Ave. and 19,800 on Montrose Ave
Description
Rare opportunity to purchase fully occupied, well maintained mixed use building in Chicago's beautiful Portage Park/Jefferson Park area on Milwaukee Avenue. Offered below market value and well below replaced cost.
Location
Located right off busy Milwaukee Ave, just north of Montrose with plenty of parking available.
No part of this information may be copied, reproduced, repurposed, or screen-captured for any commercial purpose without prior written authorization from MyEListing.
While we strive to provide the most accurate information, all listing information, and demographic data, is provided by third-parties. As such, MyEListing will not be responsible for the accuracy of the information. It is strongly recommended that you verify all information with the listing agent, and any relevant agencies, prior to making any decisions.
What is the asking price for 4425 North Milwaukee Avenue in Chicago?
The asking price for 4425 North Milwaukee Avenue is $3,200,000
What is the building size of this Multifamily property in Chicago, IL?
The size of the building/unit at 4425 North Milwaukee Avenue in Chicago is 18,000 square feet
How much land does the Chicago, IL property at 4425 North Milwaukee Avenue include?
4425 North Milwaukee Avenue in Chicago includes 0.689 acres of land
What is the population within 1 mile of 4425 North Milwaukee Avenue in Chicago?
The population within 1 mile of 4425 North Milwaukee Avenue Chicago, IL 60630 is 43,992 people.
Who do I contact for questions about 4425 North Milwaukee Avenue?
You should contact the listing agent,
Paul Tsakiris, for any details regarding this commercial listing.