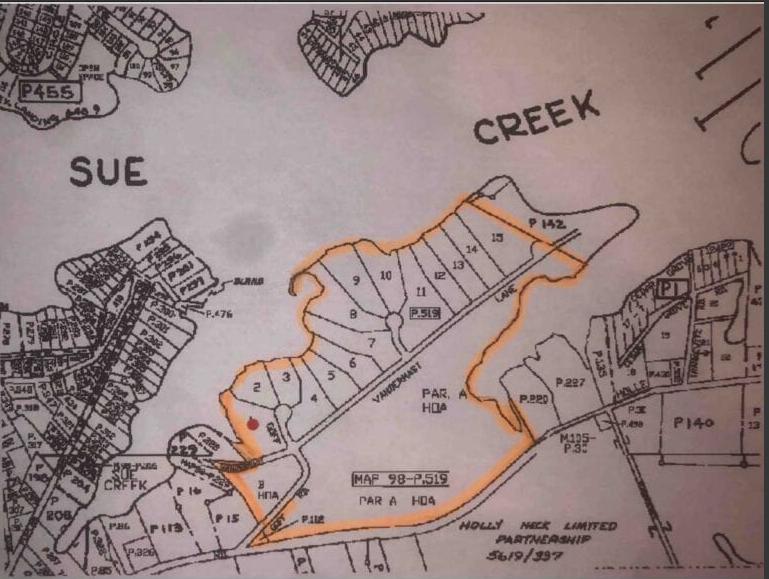
1-Mile | 3-Miles | 5-Miles | ||
---|---|---|---|---|
Total Population | 2,886 | 35,832 | 122,461 | |
Population Median Age | 46 | 39 | 40 | |
Population by Age | 0-9 Yrs | 273 (9%) | 5121 (14%) | 16240 (13%) |
10-19 Yrs | 232 (8%) | 3816 (10%) | 14441 (11%) | |
20-29 Yrs | 304 (10%) | 4854 (13%) | 15364 (12%) | |
30-39 Yrs | 328 (11%) | 4253 (11%) | 15031 (12%) | |
40-49 Yrs | 262 (9%) | 3858 (10%) | 14509 (11%) | |
50-59 Yrs | 489 (16%) | 5503 (15%) | 18001 (14%) | |
60-69 Yrs | 588 (20%) | 4835 (13%) | 15939 (13%) | |
70+ Yrs | 409 (14%) | 3591 (10%) | 12935 (10%) | |
Median HH Income | $92,263 | $66,728 | $65,708 | |
Total Household Income | < 24K | 70 (6%) | 2095 (15%) | 7437 (16%) |
25-49K | 120 (11%) | 2694 (19%) | 9534 (20%) | |
50-74K | 228 (22%) | 2904 (21%) | 8862 (19%) | |
75-99K | 142 (13%) | 1708 (12%) | 6418 (14%) | |
100-199K | 321 (31%) | 3225 (23%) | 11148 (24%) | |
200K+ | 150 (14%) | 1074 (7%) | 2441 (5%) | |
Highest Education Level | No Diploma | 241 | 2889 | 11723 |
Diploma or GED | 778 | 8254 | 31533 | |
Some College | 535 | 6142 | 18711 | |
Assoc. Degree | 131 | 1977 | 6680 | |
Bachelors Degree | 331 | 3367 | 9851 | |
Higher Degree | 257 | 2201 | 6497 | |
Total Housing Units | 1,114 | 15,014 | 50,598 | |
--Owner-Occupied | 933 | 8,049 | 29,608 | |
--Renter-Occupied | 97 | 5,651 | 16,233 | |
Owner-Occupied Values | < 100K | 10 | 560 | 3549 |
100-199K | 213 | 1916 | 9668 | |
200-299K | 258 | 1708 | 7125 | |
300-399K | 138 | 1531 | 4509 | |
400-499K | 134 | 906 | 1883 | |
500K+ | 179 | 1428 | 2873 | |
Total Working Age Population | 2,501 | 28,259 | 97,324 | |
In Work Force | 1,630 | 19,592 | 63,618 | |
Not In Work Force | 872 | 8,667 | 33,707 | |
Workforce Employed | 1,523 | 18,484 | 59,769 | |
Workforce Unemployed | 94 | 1,053 | 3,706 | |
Civlian Workforce | 1,618 | 19,537 | 63,475 | |
Military Workforce | 12 | 55 | 143 | |
Total Households | 1,030 | 13,700 | 45,841 | |
Family Households | 789 | 9,172 | 30,438 | |
Non-Family Households | 241 | 4,528 | 15,403 | |
Married Couple | 615 | 5,831 | 19,988 | |
Other Family | 174 | 3,341 | 10,450 | |
Married w/Child | 133 | 1,671 | 6,737 | |
Single Male w/Child | 29 | 583 | 1,549 | |
Single Female w/Child | 14 | 1,326 | 3,709 |
Population Change Last Two Decades - Plus Projection
2000 | % | 2010 | % | 2020 | % | 2030 | |
---|---|---|---|---|---|---|---|
Maryland | 5,296,486 | +9 | 5,773,552 | +6 | 6,141,900 | +6 | 6,518,750 |
Anne Arundel County | 489,656 | +10 | 537,656 | +7 | 573,250 | +4 | 596,700 |
Baltimore County | 754,292 | +7 | 805,029 | +5 | 847,000 | +2 | 862,200 |
Harford County | 218,590 | +12 | 244,826 | +5 | 257,700 | +5 | 271,850 |
Kent County | 19,197 | +5 | 20,197 | +3 | 20,900 | +6 | 22,100 |
Queen Annes County | 40,563 | +18 | 47,798 | +6 | 50,750 | +10 | 55,750 |
Total Working Age Population:
Total Households:
Total Working Age Population:
Total Households:
Total Working Age Population:
Total Households: