Industrial Properties
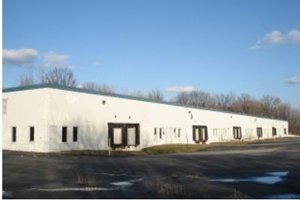
31393 Industrial Parkway North Olmsted, OH 44070
31393 Industrial Parkway North Olmsted, OH 44070

Details & Description
Listing Agents

Kevin Kelly
M: 216-525-1480
kkelly@crescorealestate.com
M: 216-525-1480
kkelly@crescorealestate.com
While we strive to provide the most accurate information, all listing information, and demographic data, is provided by third-parties. As such, MyEListing will not be responsible for the accuracy of the information. It is strongly recommended that you verify all information with the listing agent, and any relevant agencies, prior to making any decisions.