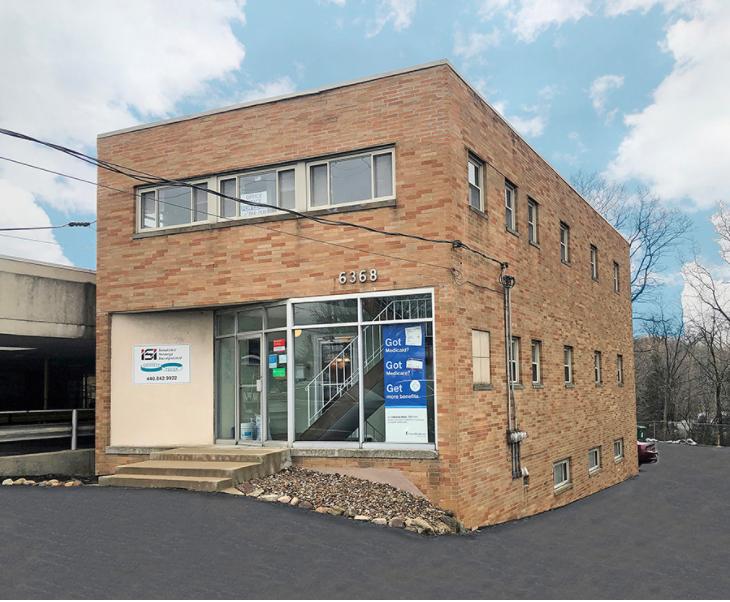
1-Mile | 3-Miles | 5-Miles | ||
---|---|---|---|---|
Total Population | 13,882 | 103,493 | 262,247 | |
Population Median Age | 43 | 42 | 41 | |
Population by Age | 0-9 Yrs | 1450 (10%) | 10694 (10%) | 27751 (10%) |
10-19 Yrs | 1271 (9%) | 10887 (10%) | 30998 (11%) | |
20-29 Yrs | 2058 (14%) | 14133 (13%) | 35530 (13%) | |
30-39 Yrs | 1626 (11%) | 12579 (12%) | 33474 (12%) | |
40-49 Yrs | 1434 (10%) | 11934 (11%) | 30819 (11%) | |
50-59 Yrs | 2119 (15%) | 15357 (14%) | 38765 (14%) | |
60-69 Yrs | 1801 (12%) | 12735 (12%) | 32100 (12%) | |
70+ Yrs | 2122 (15%) | 15174 (14%) | 32810 (12%) | |
Median HH Income | $52,225 | $55,987 | $52,963 | |
Total Household Income | < 24K | 1406 (21%) | 8320 (18%) | 23631 (21%) |
25-49K | 1643 (25%) | 11318 (25%) | 29063 (26%) | |
50-74K | 1542 (23%) | 9978 (22%) | 22694 (20%) | |
75-99K | 809 (12%) | 6357 (14%) | 15011 (13%) | |
100-199K | 958 (14%) | 7882 (17%) | 18266 (16%) | |
200K+ | 80 (1%) | 792 (1%) | 2501 (2%) | |
Highest Education Level | No Diploma | 801 | 6921 | 20746 |
Diploma or GED | 3365 | 27357 | 64769 | |
Some College | 2501 | 17108 | 41727 | |
Assoc. Degree | 1054 | 7197 | 16437 | |
Bachelors Degree | 1731 | 11685 | 29360 | |
Higher Degree | 785 | 5190 | 13688 | |
Total Housing Units | 6,952 | 47,320 | 119,377 | |
--Owner-Occupied | 3,750 | 30,977 | 73,687 | |
--Renter-Occupied | 2,689 | 13,671 | 37,478 | |
Owner-Occupied Values | < 100K | 1165 | 8992 | 27876 |
100-199K | 2439 | 19831 | 37913 | |
200-299K | 133 | 1795 | 5842 | |
300-399K | 2 | 252 | 1357 | |
400-499K | 0 | 41 | 305 | |
500K+ | 12 | 65 | 394 | |
Total Working Age Population | 11,739 | 86,323 | 216,612 | |
In Work Force | 7,629 | 55,836 | 140,407 | |
Not In Work Force | 4,110 | 30,486 | 76,205 | |
Workforce Employed | 7,313 | 52,613 | 131,218 | |
Workforce Unemployed | 316 | 3,215 | 9,127 | |
Civlian Workforce | 7,629 | 55,828 | 140,345 | |
Military Workforce | 0 | 8 | 62 | |
Total Households | 6,438 | 44,647 | 111,165 | |
Family Households | 3,354 | 26,781 | 64,974 | |
Non-Family Households | 3,085 | 17,867 | 46,191 | |
Married Couple | 2,523 | 18,837 | 44,064 | |
Other Family | 831 | 7,944 | 20,910 | |
Married w/Child | 882 | 6,155 | 15,090 | |
Single Male w/Child | 104 | 1,010 | 2,585 | |
Single Female w/Child | 272 | 2,511 | 7,434 |
Population Change Last Two Decades - Plus Projection
2000 | % | 2010 | % | 2020 | % | 2030 | |
---|---|---|---|---|---|---|---|
Ohio | 11,353,140 | +2 | 11,536,504 | 0 | 11,574,870 | 0 | 11,615,100 |
Cuyahoga County | 1,393,978 | -8 | 1,280,122 | -6 | 1,209,550 | -5 | 1,154,210 |
Summit County | 542,899 | 0 | 541,781 | -1 | 534,150 | -1 | 528,990 |
Total Working Age Population:
Total Households:
Total Working Age Population:
Total Households:
Total Working Age Population:
Total Households: