Specialty Real Estate
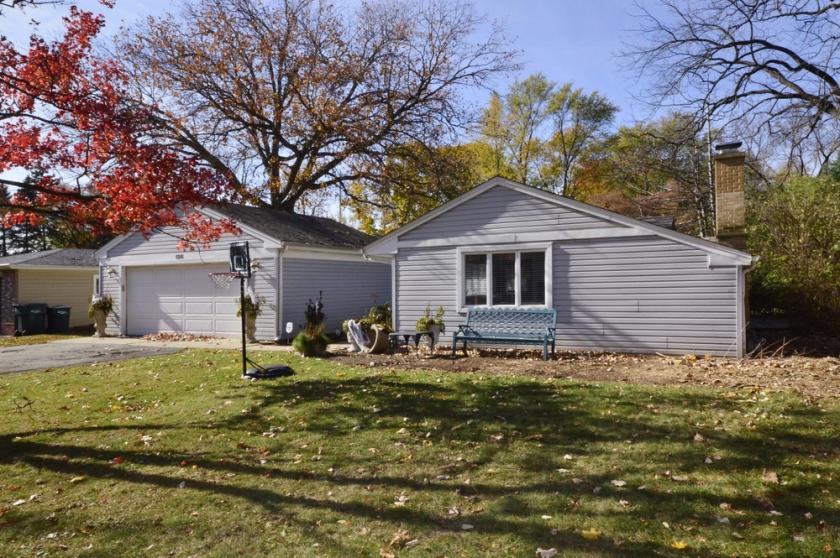
125 Lockerbie Lane Wilmette, IL 60091
125 Lockerbie Lane Wilmette, IL 60091
Details & Description
Listing Agents

Debby Gross
O: 847-471-0354
dgross@jameson.com
O: 847-471-0354
dgross@jameson.com
While we strive to provide the most accurate information, all listing information, and demographic data, is provided by third-parties. As such, MyEListing will not be responsible for the accuracy of the information. It is strongly recommended that you verify all information with the listing agent, and any relevant agencies, prior to making any decisions.


