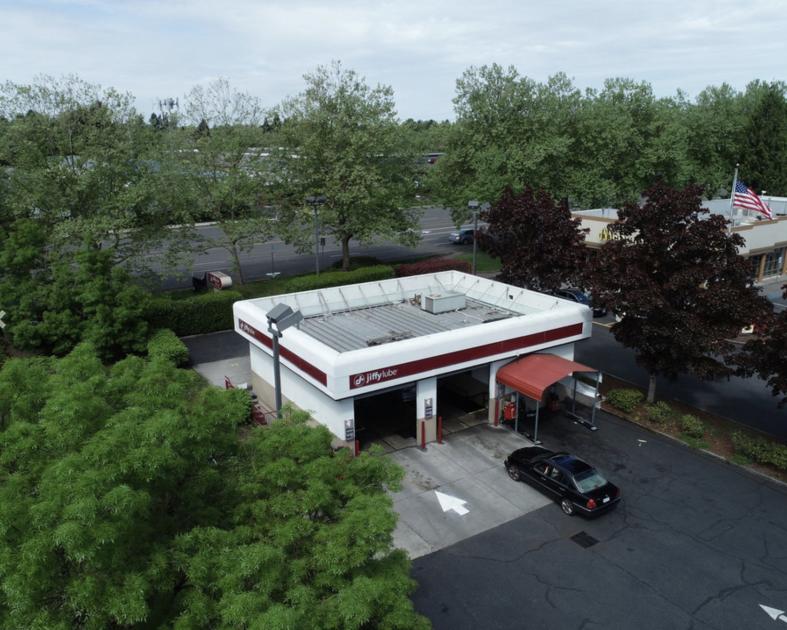
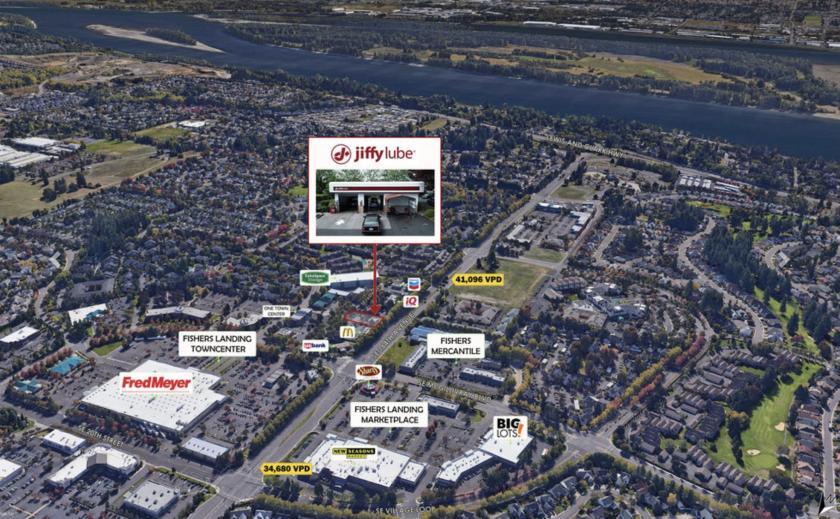
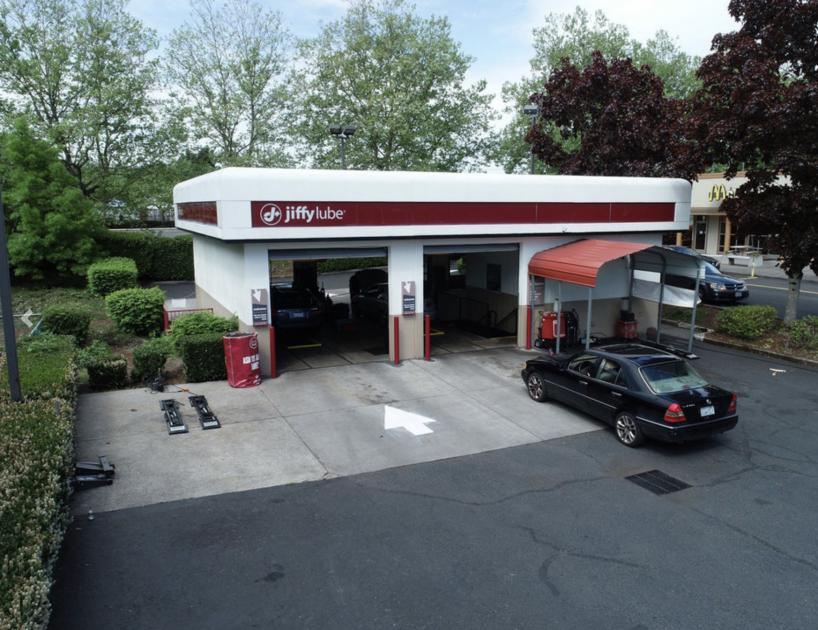
1-Mile | 3-Miles | 5-Miles | ||
---|---|---|---|---|
Total Population | 16,375 | 78,117 | 189,571 | |
Population Median Age | 42 | 39 | 39 | |
Population by Age | 0-9 Yrs | 1919 (11%) | 9758 (12%) | 23105 (12%) |
10-19 Yrs | 1852 (11%) | 10066 (12%) | 24169 (12%) | |
20-29 Yrs | 1873 (11%) | 9223 (11%) | 23597 (12%) | |
30-39 Yrs | 1909 (11%) | 10543 (13%) | 26359 (13%) | |
40-49 Yrs | 2180 (13%) | 11094 (14%) | 26399 (13%) | |
50-59 Yrs | 1766 (10%) | 9021 (11%) | 23326 (12%) | |
60-69 Yrs | 2242 (13%) | 9589 (12%) | 22656 (11%) | |
70+ Yrs | 2635 (16%) | 8824 (11%) | 19961 (10%) | |
Median HH Income | $71,257 | $76,985 | $72,792 | |
Total Household Income | < 24K | 966 (13%) | 2884 (9%) | 8495 (11%) |
25-49K | 1455 (20%) | 6066 (20%) | 15000 (20%) | |
50-74K | 1279 (18%) | 5684 (18%) | 13523 (18%) | |
75-99K | 1014 (14%) | 4380 (14%) | 10387 (14%) | |
100-199K | 1789 (25%) | 8386 (27%) | 18962 (26%) | |
200K+ | 531 (7%) | 2565 (8%) | 5249 (7%) | |
Highest Education Level | No Diploma | 675 | 3639 | 10811 |
Diploma or GED | 2242 | 10528 | 30072 | |
Some College | 3203 | 14383 | 34867 | |
Assoc. Degree | 1087 | 5604 | 12538 | |
Bachelors Degree | 3006 | 12797 | 27834 | |
Higher Degree | 1658 | 7255 | 15429 | |
Total Housing Units | 7,224 | 31,125 | 74,875 | |
--Owner-Occupied | 4,120 | 18,784 | 46,300 | |
--Renter-Occupied | 2,913 | 11,180 | 25,316 | |
Owner-Occupied Values | < 100K | 221 | 661 | 1948 |
100-199K | 307 | 1276 | 4166 | |
200-299K | 1106 | 4866 | 13917 | |
300-399K | 1370 | 5718 | 13850 | |
400-499K | 714 | 3313 | 6225 | |
500K+ | 403 | 2950 | 6194 | |
Total Working Age Population | 13,442 | 62,337 | 151,755 | |
In Work Force | 8,037 | 39,718 | 97,787 | |
Not In Work Force | 5,404 | 22,620 | 53,968 | |
Workforce Employed | 7,591 | 37,673 | 92,970 | |
Workforce Unemployed | 400 | 1,954 | 4,601 | |
Civlian Workforce | 7,991 | 39,626 | 97,572 | |
Military Workforce | 46 | 91 | 215 | |
Total Households | 7,033 | 29,964 | 71,616 | |
Family Households | 4,322 | 20,466 | 48,285 | |
Non-Family Households | 2,711 | 9,498 | 23,332 | |
Married Couple | 3,503 | 16,381 | 37,306 | |
Other Family | 819 | 4,085 | 10,978 | |
Married w/Child | 1,366 | 6,785 | 15,193 | |
Single Male w/Child | 88 | 650 | 1,687 | |
Single Female w/Child | 414 | 1,656 | 4,235 |
Population Change Last Two Decades - Plus Projection
2000 | % | 2010 | % | 2020 | % | 2030 | |
---|---|---|---|---|---|---|---|
Oregon | 3,421,399 | +12 | 3,831,074 | +11 | 4,264,810 | +11 | 4,727,438 |
Multnomah County | 660,486 | +11 | 735,334 | +12 | 822,675 | +10 | 906,904 |
Washington | 5,894,121 | +14 | 6,724,540 | +14 | 7,638,415 | +11 | 8,503,178 |
Clark County | 345,238 | +23 | 425,363 | +17 | 499,400 | +16 | 576,879 |
Total Working Age Population:
Total Households:
Total Working Age Population:
Total Households:
Total Working Age Population:
Total Households: