Industrial Properties
13700 Olean Road Chaffee, NY 14030
13700 Olean Road Chaffee, NY 14030
Details & Description
Property Highlights
- • Excellent Location
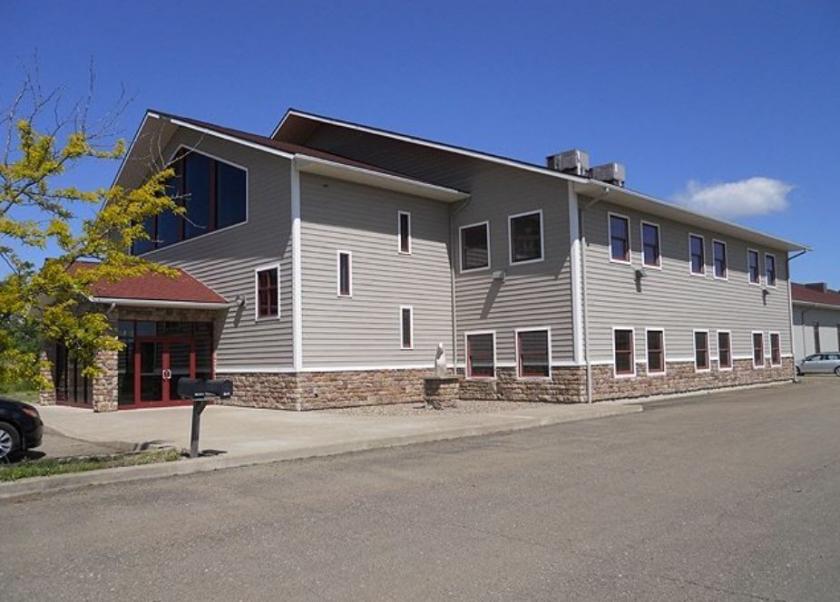
- • Built in 2017 & 2022
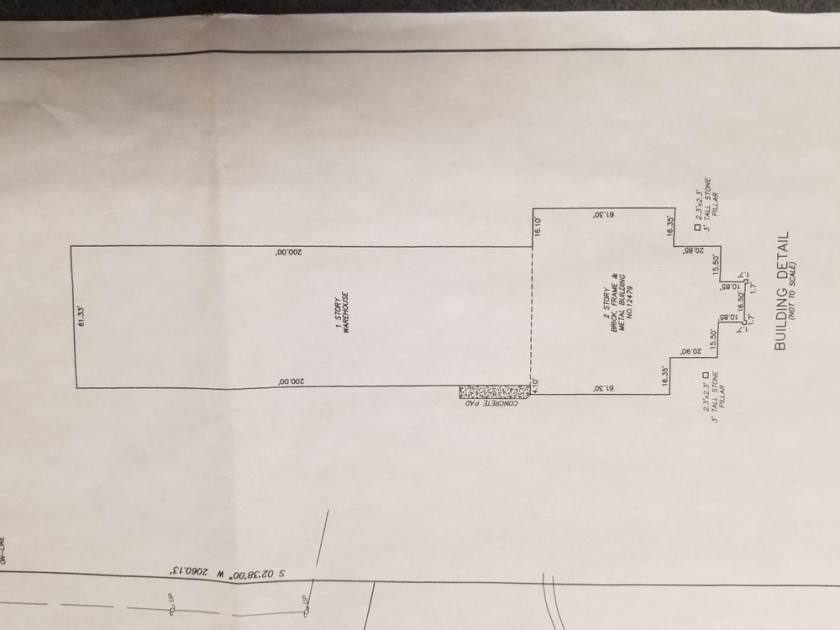
- • 77.20 - Acres
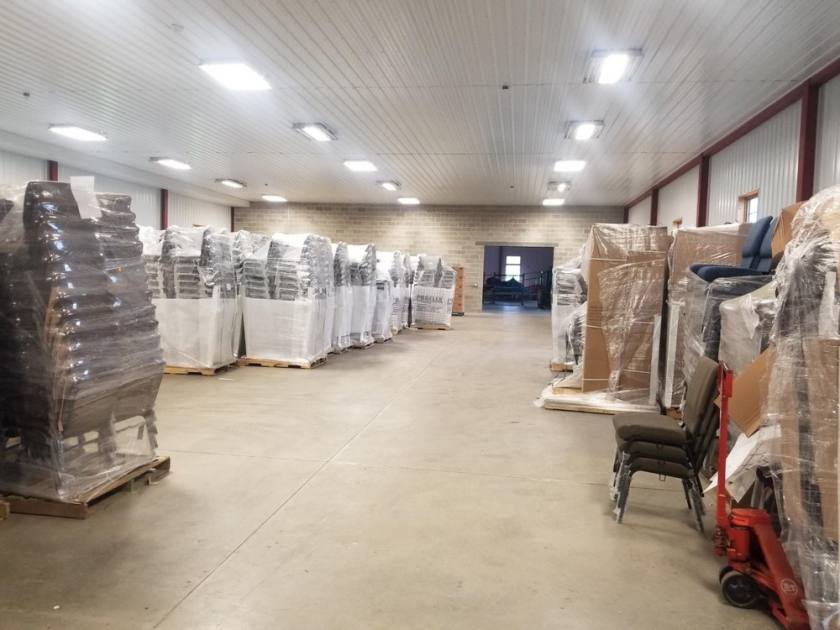
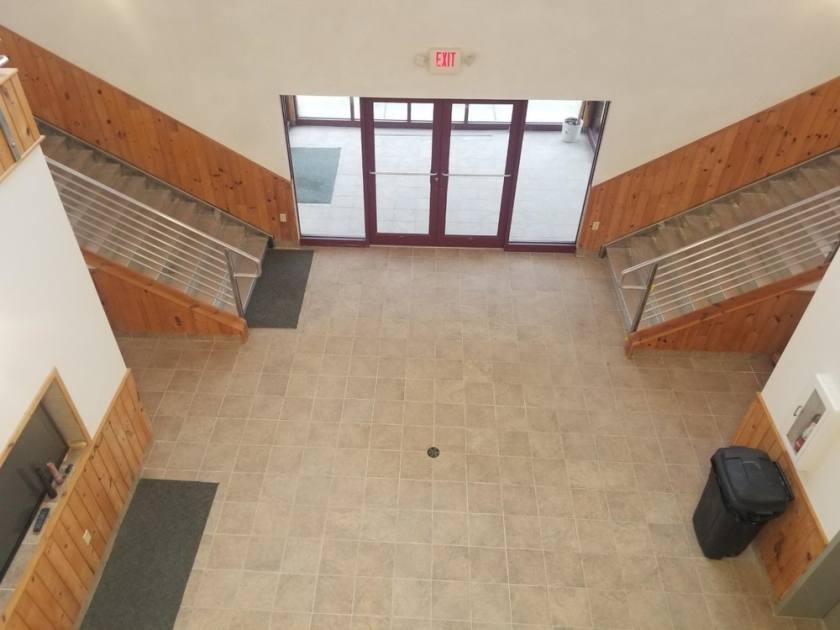
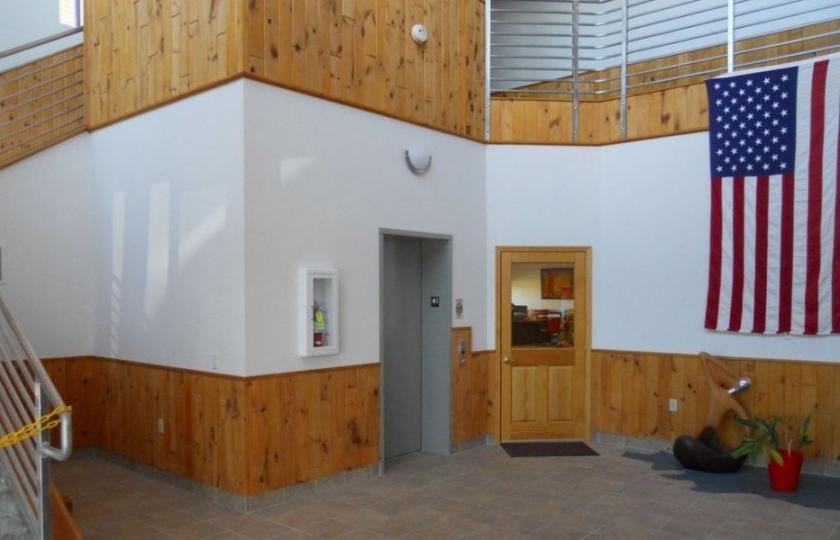
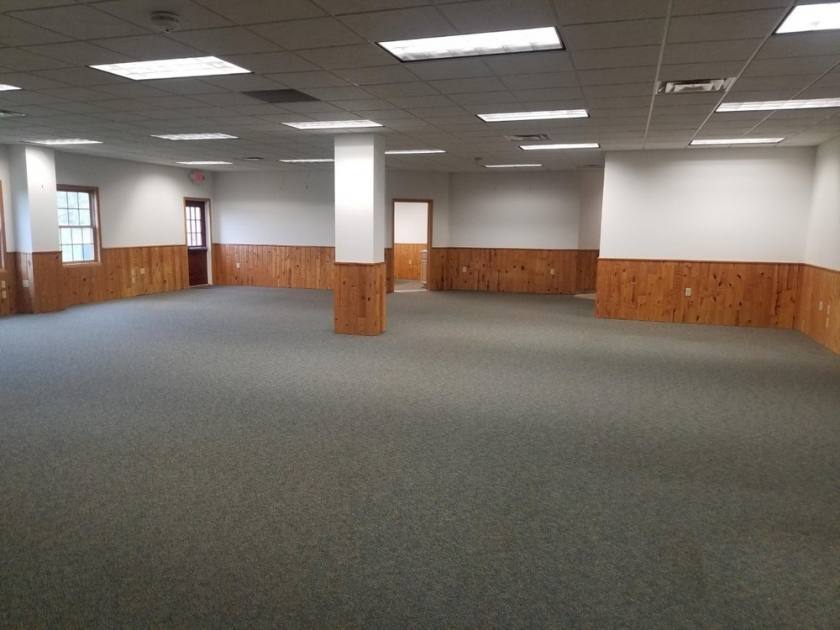
Additional Photos


Listing Agents

Rick Recckio
O: 716-631-5555
M: 716-998-4422
rick@recckio.com
O: 716-631-5555
M: 716-998-4422
rick@recckio.com
While we strive to provide the most accurate information, all listing information, and demographic data, is provided by third-parties. As such, MyEListing will not be responsible for the accuracy of the information. It is strongly recommended that you verify all information with the listing agent, and any relevant agencies, prior to making any decisions.