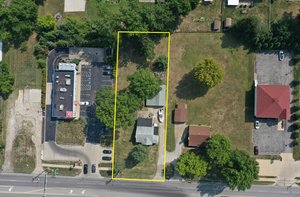
1-Mile | 3-Miles | 5-Miles | ||
---|---|---|---|---|
Total Population | 3,249 | 36,547 | 74,488 | |
Population Median Age | 45 | 41 | 40 | |
Population by Age | 0-9 Yrs | 226 (6%) | 4414 (12%) | 9102 (12%) |
10-19 Yrs | 396 (12%) | 4201 (11%) | 9330 (12%) | |
20-29 Yrs | 379 (11%) | 4228 (11%) | 9355 (12%) | |
30-39 Yrs | 279 (8%) | 4067 (11%) | 8075 (10%) | |
40-49 Yrs | 453 (13%) | 4866 (13%) | 9568 (12%) | |
50-59 Yrs | 576 (17%) | 4997 (13%) | 10103 (13%) | |
60-69 Yrs | 443 (13%) | 4971 (13%) | 10182 (13%) | |
70+ Yrs | 496 (15%) | 4804 (13%) | 8773 (11%) | |
Median HH Income | $65,455 | $61,205 | $47,726 | |
Total Household Income | < 24K | 275 (20%) | 3073 (20%) | 8685 (28%) |
25-49K | 295 (21%) | 3093 (20%) | 7192 (23%) | |
50-74K | 211 (15%) | 2770 (18%) | 5382 (17%) | |
75-99K | 178 (13%) | 2240 (15%) | 3973 (13%) | |
100-199K | 308 (22%) | 2996 (20%) | 4453 (14%) | |
200K+ | 85 (6%) | 594 (4%) | 837 (2%) | |
Highest Education Level | No Diploma | 219 | 2336 | 7015 |
Diploma or GED | 728 | 8131 | 17097 | |
Some College | 545 | 6289 | 12793 | |
Assoc. Degree | 351 | 3526 | 5826 | |
Bachelors Degree | 405 | 3809 | 6008 | |
Higher Degree | 217 | 1977 | 3232 | |
Total Housing Units | 1,528 | 15,859 | 34,373 | |
--Owner-Occupied | 1,021 | 10,925 | 19,824 | |
--Renter-Occupied | 331 | 3,842 | 10,699 | |
Owner-Occupied Values | < 100K | 187 | 2322 | 7020 |
100-199K | 500 | 5755 | 8703 | |
200-299K | 237 | 2083 | 2771 | |
300-399K | 70 | 528 | 855 | |
400-499K | 10 | 114 | 251 | |
500K+ | 17 | 123 | 224 | |
Total Working Age Population | 2,778 | 29,717 | 60,361 | |
In Work Force | 1,705 | 18,186 | 35,085 | |
Not In Work Force | 1,074 | 11,531 | 25,277 | |
Workforce Employed | 1,530 | 17,150 | 32,683 | |
Workforce Unemployed | 174 | 1,036 | 2,399 | |
Civlian Workforce | 1,705 | 18,186 | 35,082 | |
Military Workforce | 0 | 0 | 3 | |
Total Households | 1,353 | 14,767 | 30,523 | |
Family Households | 809 | 9,969 | 18,873 | |
Non-Family Households | 544 | 4,798 | 11,650 | |
Married Couple | 601 | 7,168 | 12,429 | |
Other Family | 208 | 2,800 | 6,444 | |
Married w/Child | 242 | 2,508 | 4,216 | |
Single Male w/Child | 3 | 170 | 626 | |
Single Female w/Child | 58 | 1,292 | 2,911 |
Population Change Last Two Decades - Plus Projection
2000 | % | 2010 | % | 2020 | % | 2030 | |
---|---|---|---|---|---|---|---|
Ohio | 11,353,140 | +2 | 11,536,504 | 0 | 11,574,870 | 0 | 11,615,100 |
Lorain County | 284,664 | +6 | 301,356 | +3 | 310,230 | +3 | 320,430 |
Total Working Age Population:
Total Households:
Total Working Age Population:
Total Households:
Total Working Age Population:
Total Households: