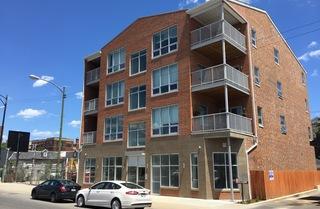
1-Mile | 3-Miles | 5-Miles | ||
---|---|---|---|---|
Total Population | 67,918 | 526,621 | 1,317,939 | |
Population Median Age | 34 | 34 | 36 | |
Population by Age | 0-9 Yrs | 7040 (10%) | 58608 (11%) | 142543 (10%) |
10-19 Yrs | 3976 (5%) | 43959 (8%) | 121766 (9%) | |
20-29 Yrs | 17340 (25%) | 128166 (24%) | 280166 (21%) | |
30-39 Yrs | 19553 (28%) | 120350 (22%) | 271684 (20%) | |
40-49 Yrs | 8559 (12%) | 65508 (12%) | 164228 (12%) | |
50-59 Yrs | 5339 (7%) | 46681 (8%) | 136682 (10%) | |
60-69 Yrs | 3348 (4%) | 36239 (6%) | 112755 (8%) | |
70+ Yrs | 2762 (4%) | 27109 (5%) | 88115 (6%) | |
Median HH Income | $99,787 | $87,756 | $75,984 | |
Total Household Income | < 24K | 4181 (13%) | 37108 (16%) | 106441 (18%) |
25-49K | 3416 (11%) | 31640 (14%) | 92068 (16%) | |
50-74K | 3851 (12%) | 30806 (13%) | 80640 (14%) | |
75-99K | 3608 (12%) | 26202 (11%) | 65221 (11%) | |
100-199K | 9106 (30%) | 60599 (26%) | 137836 (24%) | |
200K+ | 5889 (19%) | 39494 (17%) | 81230 (14%) | |
Highest Education Level | No Diploma | 3431 | 38517 | 120096 |
Diploma or GED | 6176 | 52372 | 153380 | |
Some College | 4834 | 43610 | 124730 | |
Assoc. Degree | 2119 | 15409 | 42872 | |
Bachelors Degree | 22289 | 139012 | 291013 | |
Higher Degree | 13803 | 92668 | 216928 | |
Total Housing Units | 32,794 | 251,608 | 637,685 | |
--Owner-Occupied | 11,849 | 91,691 | 227,453 | |
--Renter-Occupied | 18,202 | 134,157 | 335,982 | |
Owner-Occupied Values | < 100K | 222 | 2939 | 10304 |
100-199K | 309 | 7315 | 29360 | |
200-299K | 1404 | 14959 | 47561 | |
300-399K | 2384 | 15687 | 41154 | |
400-499K | 1996 | 13935 | 28470 | |
500K+ | 5534 | 36856 | 70605 | |
Total Working Age Population | 58,283 | 441,565 | 1,104,607 | |
In Work Force | 47,691 | 341,078 | 796,500 | |
Not In Work Force | 10,592 | 100,487 | 308,107 | |
Workforce Employed | 46,389 | 326,592 | 754,795 | |
Workforce Unemployed | 1,294 | 14,437 | 41,247 | |
Civlian Workforce | 47,683 | 341,029 | 796,041 | |
Military Workforce | 7 | 48 | 459 | |
Total Households | 30,051 | 225,848 | 563,436 | |
Family Households | 12,653 | 100,588 | 263,708 | |
Non-Family Households | 17,398 | 125,260 | 299,728 | |
Married Couple | 9,347 | 71,378 | 180,244 | |
Other Family | 3,306 | 29,210 | 83,464 | |
Married w/Child | 3,900 | 30,665 | 68,842 | |
Single Male w/Child | 378 | 2,782 | 8,162 | |
Single Female w/Child | 1,044 | 10,577 | 29,894 |
Population Change Last Two Decades - Plus Projection
2000 | % | 2010 | % | 2020 | % | 2030 | |
---|---|---|---|---|---|---|---|
Illinois | 12,419,293 | +3 | 12,830,632 | +12 | 14,316,487 | +6 | 15,138,849 |
Cook County | 5,376,741 | -3 | 5,194,675 | +10 | 5,707,832 | +5 | 5,990,243 |
Total Working Age Population:
Total Households:
Total Working Age Population:
Total Households:
Total Working Age Population:
Total Households: