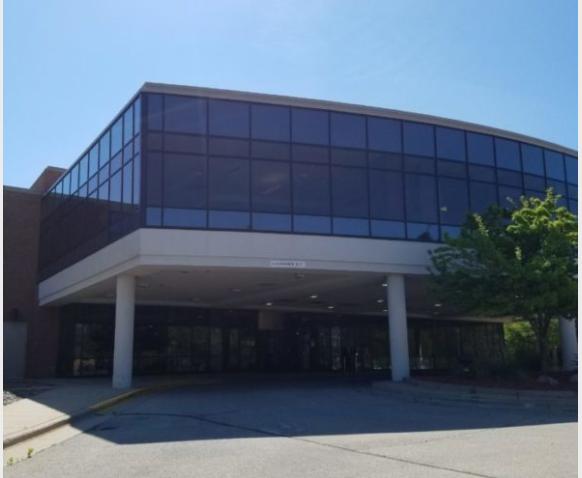
Features
– Building and mechanicals maintained at high medical standards; inside & out
– Secluded & serene setting along Lake Michigan
– Within close proximity to shopping, parks, Marinette High School, the new Marinette Community REC Center, UW Green Bay -Marinette Campus, Northeast – – Wisconsin Technical College, and the new Aurora Bay Area Medical Center
– Ample parking and excess acreage
Basic Details:
LOT SIZE: 20.28 Acres
ZONING: I-1 Institutional District
PARKING: 700 Stalls (Approximately)
TOPOGRAPHY: Level
YEAR BUILT: Original Hospital was built in 1939 with additions in 1964, 1967, 1970, 1990, 2000, and 2004. Most of the square footage is from 1990 or newer.
SALE PRICE: Contact Broker
No part of this information may be copied, reproduced, repurposed, or screen-captured for any commercial purpose without prior written authorization from MyEListing.
While we strive to provide the most accurate information, all listing information, and demographic data, is provided by third-parties. As such, MyEListing will not be responsible for the accuracy of the information. It is strongly recommended that you verify all information with the listing agent, and any relevant agencies, prior to making any decisions.
What is the building size of this Office property in Marinette, WI?
The size of the building/unit at 3100 Shore Drive in Marinette is 300,395 square feet
How much land does the Marinette, WI property at 3100 Shore Drive include?
3100 Shore Drive in Marinette includes 20.280 acres of land
What kind of Office is the propery at 3100 Shore Drive?
The property at 3100 Shore Drive Marinette, WI 54143 is listed as a Medical Office property
What is the population within 1 mile of 3100 Shore Drive in Marinette?
The population within 1 mile of 3100 Shore Drive Marinette, WI 54143 is 2,401 people.
Who do I contact for questions about 3100 Shore Drive?
You should contact the listing agent,
Mike Keane, for any details regarding this commercial listing.