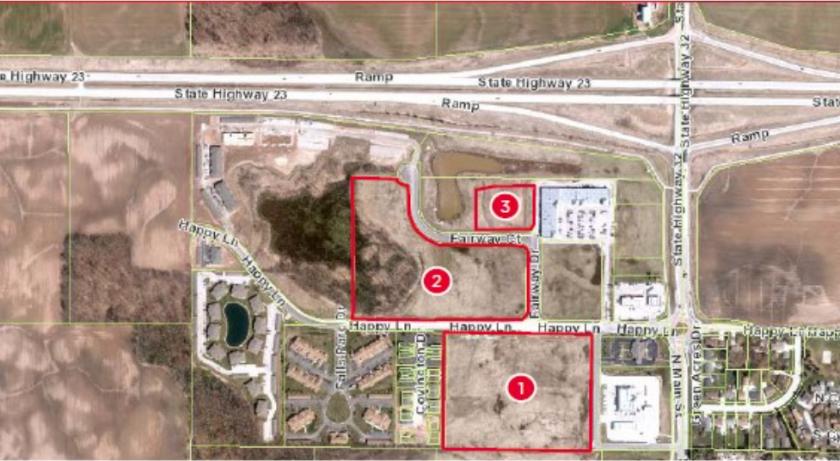
1-Mile | 3-Miles | 5-Miles | ||
---|---|---|---|---|
Total Population | 1,261 | 12,784 | 41,746 | |
Population Median Age | 40 | 42 | 41 | |
Population by Age | 0-9 Yrs | 145 (11%) | 1203 (9%) | 4858 (11%) |
10-19 Yrs | 154 (12%) | 1793 (14%) | 5361 (12%) | |
20-29 Yrs | 150 (11%) | 1265 (9%) | 4999 (11%) | |
30-39 Yrs | 171 (13%) | 1470 (11%) | 4895 (11%) | |
40-49 Yrs | 137 (10%) | 1603 (12%) | 5032 (12%) | |
50-59 Yrs | 202 (16%) | 1862 (14%) | 6064 (14%) | |
60-69 Yrs | 175 (13%) | 1943 (15%) | 5355 (12%) | |
70+ Yrs | 127 (10%) | 1646 (12%) | 5184 (12%) | |
Median HH Income | $56,986 | $62,751 | $58,011 | |
Total Household Income | < 24K | 79 (13%) | 833 (14%) | 3063 (17%) |
25-49K | 165 (28%) | 1387 (24%) | 4597 (25%) | |
50-74K | 163 (27%) | 1208 (21%) | 3843 (21%) | |
75-99K | 73 (12%) | 765 (13%) | 2555 (14%) | |
100-199K | 94 (16%) | 1172 (20%) | 3297 (18%) | |
200K+ | 12 (2%) | 249 (4%) | 509 (2%) | |
Highest Education Level | No Diploma | 43 | 385 | 1949 |
Diploma or GED | 397 | 3260 | 11020 | |
Some College | 173 | 1839 | 5808 | |
Assoc. Degree | 74 | 846 | 3168 | |
Bachelors Degree | 90 | 1810 | 5134 | |
Higher Degree | 95 | 1053 | 2114 | |
Total Housing Units | 596 | 5,744 | 18,556 | |
--Owner-Occupied | 373 | 4,032 | 12,089 | |
--Renter-Occupied | 213 | 1,581 | 5,775 | |
Owner-Occupied Values | < 100K | 130 | 549 | 2877 |
100-199K | 154 | 1749 | 5740 | |
200-299K | 54 | 1101 | 2287 | |
300-399K | 15 | 370 | 717 | |
400-499K | 15 | 128 | 209 | |
500K+ | 6 | 136 | 258 | |
Total Working Age Population | 1,008 | 10,447 | 33,607 | |
In Work Force | 720 | 6,774 | 22,083 | |
Not In Work Force | 288 | 3,674 | 11,524 | |
Workforce Employed | 704 | 6,685 | 21,191 | |
Workforce Unemployed | 16 | 86 | 865 | |
Civlian Workforce | 720 | 6,771 | 22,056 | |
Military Workforce | 0 | 2 | 27 | |
Total Households | 586 | 5,613 | 17,864 | |
Family Households | 347 | 3,650 | 11,083 | |
Non-Family Households | 240 | 1,964 | 6,782 | |
Married Couple | 270 | 3,058 | 8,898 | |
Other Family | 76 | 592 | 2,184 | |
Married w/Child | 112 | 1,121 | 3,445 | |
Single Male w/Child | 27 | 131 | 356 | |
Single Female w/Child | 21 | 221 | 941 |
Population Change Last Two Decades - Plus Projection
2000 | % | 2010 | % | 2020 | % | 2030 | |
---|---|---|---|---|---|---|---|
Wisconsin | 5,363,675 | +6 | 5,686,986 | +6 | 6,005,080 | +6 | 6,375,910 |
Sheboygan County | 112,646 | +3 | 115,507 | +4 | 119,890 | +5 | 126,160 |
Total Working Age Population:
Total Households:
Total Working Age Population:
Total Households:
Total Working Age Population:
Total Households: